 Français
  Русский
 English
 Bahasa Indonesia
 Bahasa Malay
 ไทย
ไทย Español
 Deutsch
 Български
 Tiếng Việt
 中文
中文 বাংলা
বাংলা हिन्दी
 Čeština
 Українська
 Română
FX.co ★ Modèles réels. Analyse technique et recommandations de trading

Modèles d'analyse technique
There is nothing more precious to a trader than an ability to predict a further price movement. Technical analysis is a key to your successful transaction. At the same time, you can rely on common and recurring situations that arise in the same circumstances. Our Technical Analysis Patterns section features all trading recommendations based on the technical analysis patterns that help traders make projections and turn a profit.
Outil:
All
#Bitcoin
EURCHF
EURGBP
EURJPY
EURUSD
EURCAD
EURRUB
EURNZD
USDCAD
USDCHF
USDJPY
USDRUB
NZDCAD
NZDUSD
NZDCHF
NZDJPY
AUDCAD
AUDCHF
AUDJPY
AUDUSD
GBPUSD
GBPJPY
GBPAUD
GBPCHF
GOLD
SILVER
#AAPL
#AMZN
#EBAY
#FB
#GOOG
#MCD
#MA
#KO
#INTC
#MSFT
#NTDOY
#PEP
#TSLA
#TWTR
Figure:
All
Triangle
Rectangle
Pennant
Flag
Head and Shoulders
Double Top
Triple top
Timeframe:
All
M5
M15
M30
H1
D1
Signal strength:
All
High
Medium
Low
Signal direction:
All
Buy
Sell
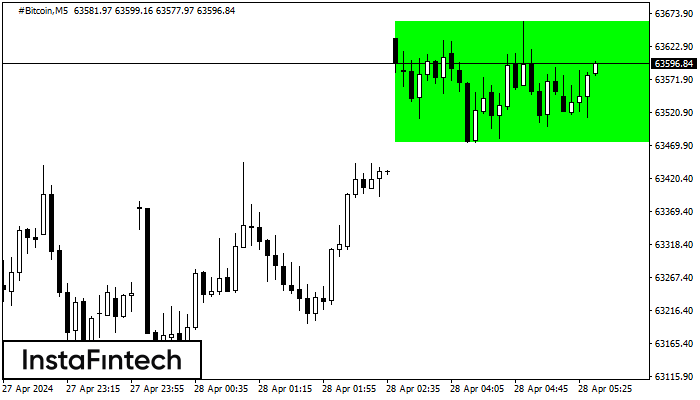
#Bitcoin M5
Bullish Rectangle
According to the chart of M5, #Bitcoin formed the Bullish Rectangle. This type of a pattern indicates a trend continuation. It consists of two levels: resistance 63661.39 and support 63475.10. In case the resistance level 63661.39 - 63661.39 is broken, the instrument is likely to follow the bullish trend.
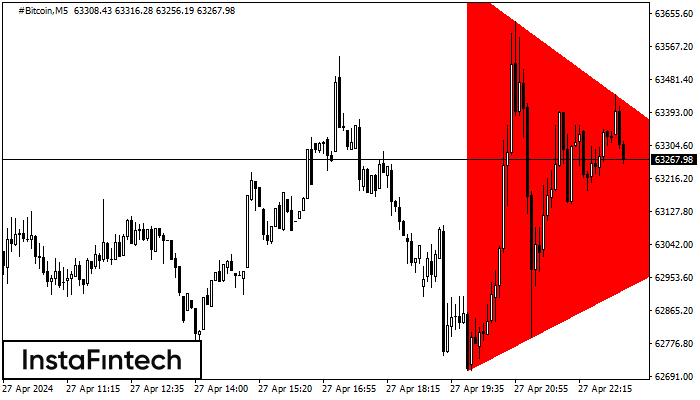
#Bitcoin M5
Bearish Symmetrical Triangle
According to the chart of M5, #Bitcoin formed the Bearish Symmetrical Triangle pattern. Description: The lower border is 62706.48/63128.43 and upper border is 63728.44/63128.43. The pattern width is measured on the chart at -102196 pips. The formation of the Bearish Symmetrical Triangle pattern evidently signals a continuation of the downward trend. In other words, if the scenario comes true and #Bitcoin breaches the lower border, the price could continue its move toward 63128.28.
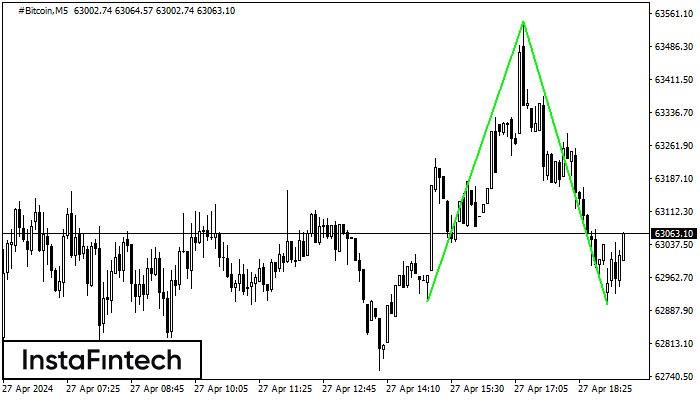
#Bitcoin M5
Double Bottom
The Double Bottom pattern has been formed on #Bitcoin M5. This formation signals a reversal of the trend from downwards to upwards. The signal is that a buy trade should be opened after the upper boundary of the pattern 63542.20 is broken. The further movements will rely on the width of the current pattern 63351 points.
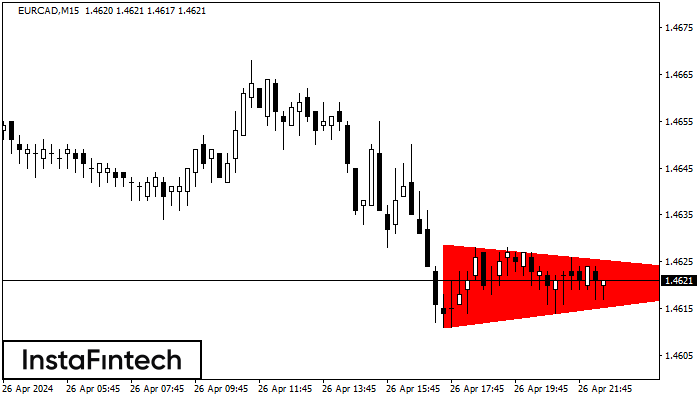
EURCAD M15
Bearish Symmetrical Triangle
According to the chart of M15, EURCAD formed the Bearish Symmetrical Triangle pattern. This pattern signals a further downward trend in case the lower border 1.4611 is breached. Here, a hypothetical profit will equal the width of the available pattern that is -18 pips.
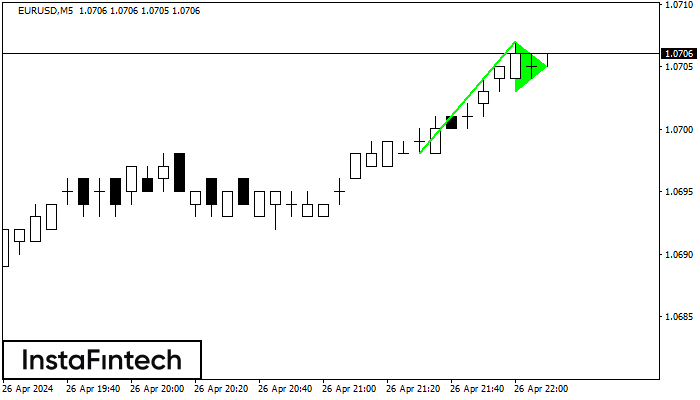
EURUSD M5
Bullish pennant
The Bullish pennant signal – Trading instrument EURUSD M5, continuation pattern. Forecast: it is possible to set up a buy position above the pattern’s high of 1.0707, with the prospect of the next move being a projection of the flagpole height.
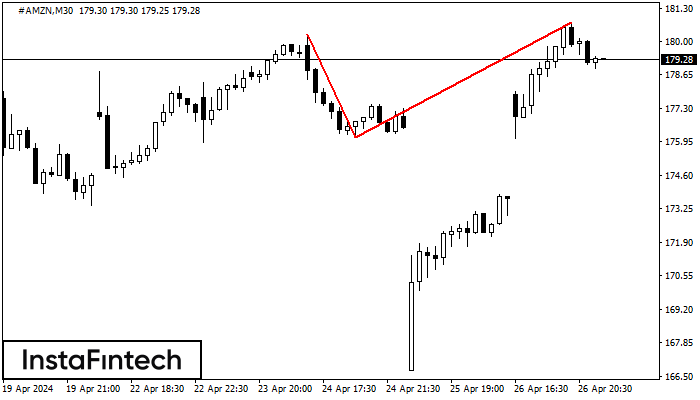
#AMZN M30
Double Top
The Double Top reversal pattern has been formed on #AMZN M30. Characteristics: the upper boundary 180.26; the lower boundary 176.12; the width of the pattern is 463 points. Sell trades are better to be opened below the lower boundary 176.12 with a possible movements towards the 175.82 level.
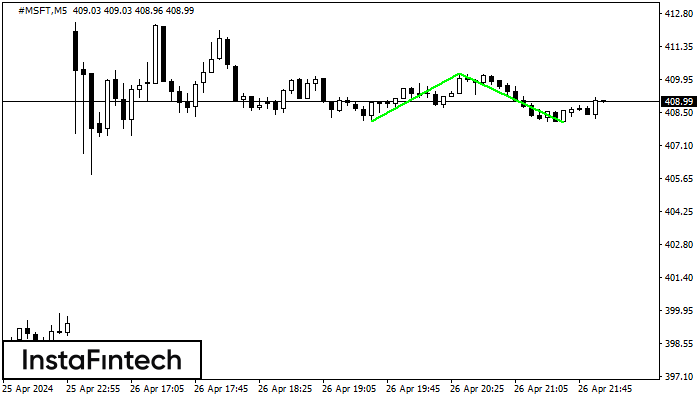
#MSFT M5
Double Bottom
The Double Bottom pattern has been formed on #MSFT M5. Characteristics: the support level 408.14; the resistance level 410.19; the width of the pattern 205 points. If the resistance level is broken, a change in the trend can be predicted with the first target point lying at the distance of 211 points.
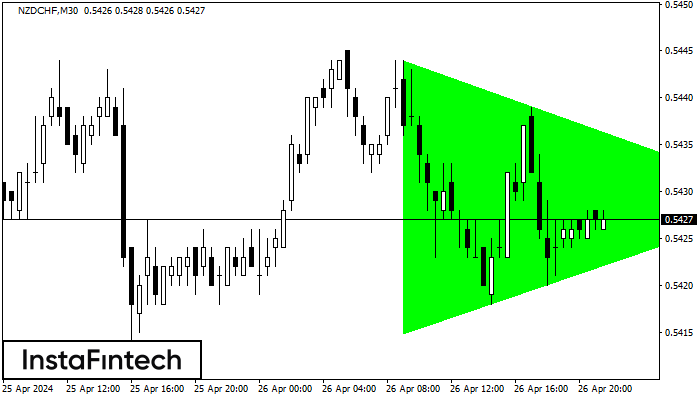
NZDCHF M30
Bullish Symmetrical Triangle
According to the chart of M30, NZDCHF formed the Bullish Symmetrical Triangle pattern. Description: This is the pattern of a trend continuation. 0.5444 and 0.5415 are the coordinates of the upper and lower borders respectively. The pattern width is measured on the chart at 29 pips. Outlook: If the upper border 0.5444 is broken, the price is likely to continue its move by 0.5459.
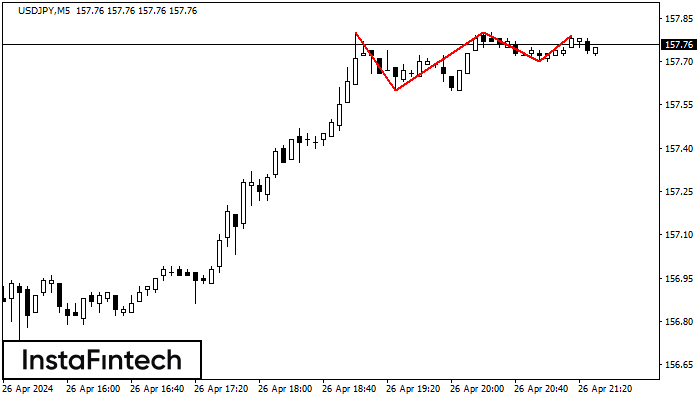
USDJPY M5
Triple Top
On the chart of the USDJPY M5 trading instrument, the Triple Top pattern that signals a trend change has formed. It is possible that after formation of the third peak, the price will try to break through the resistance level 157.60, where we advise to open a trading position for sale. Take profit is the projection of the pattern’s width, which is 20 points.
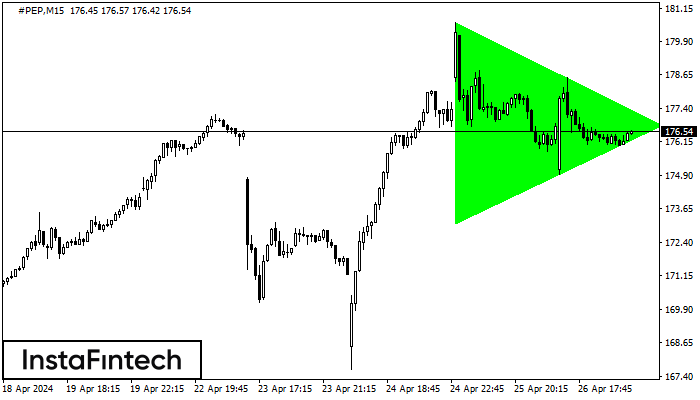
#PEP M15
Bullish Symmetrical Triangle
According to the chart of M15, #PEP formed the Bullish Symmetrical Triangle pattern. Description: This is the pattern of a trend continuation. 180.61 and 173.10 are the coordinates of the upper and lower borders respectively. The pattern width is measured on the chart at 751 pips. Outlook: If the upper border 180.61 is broken, the price is likely to continue its move by 176.99.