 English
  Русский
 Bahasa Indonesia
 Bahasa Malay
 ไทย
ไทย Español
 Deutsch
 Български
 Français
 Tiếng Việt
 中文
中文 বাংলা
বাংলা हिन्दी
 Čeština
 Українська
 Română
FX.co ★ Patterns USDCAD | US Dollar (USD) to the Canadian Dollar (CAD) Rate in the Forex market

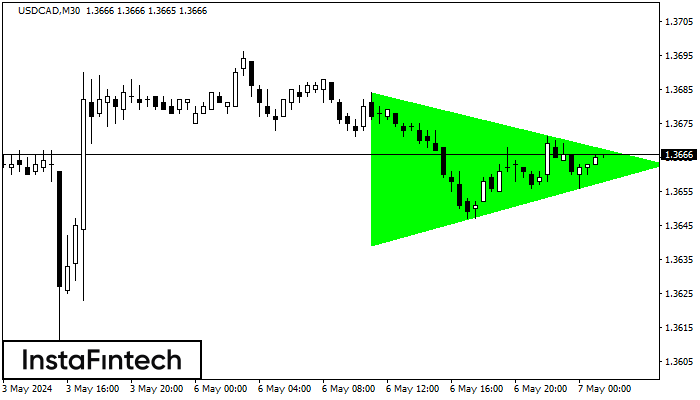
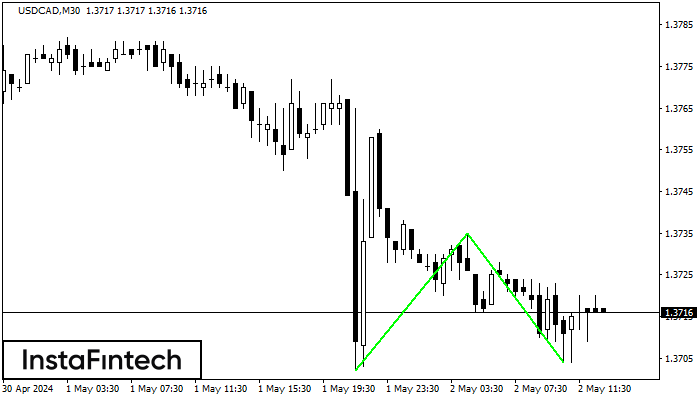
USDCAD M30
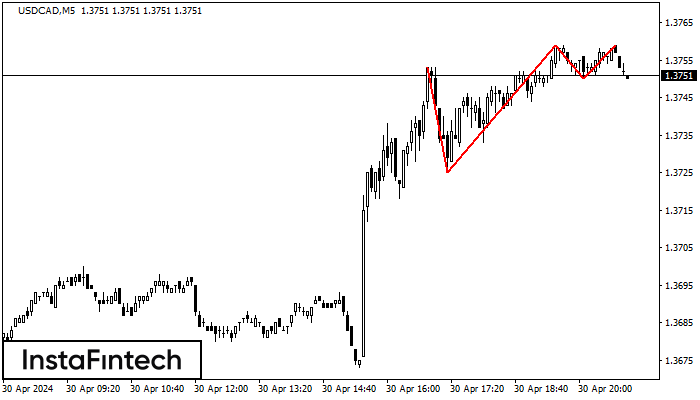
Bullish Symmetrical Triangle
According to the chart of M30, USDCAD formed the Bullish Symmetrical Triangle pattern, which signals the trend will continue. Description. The upper border of the pattern touches the coordinates 1.3684/1.3663 whereas the lower border goes across 1.3639/1.3663. The pattern width is measured on the chart at 45 pips. If the Bullish Symmetrical Triangle pattern is in progress during the upward trend, this indicates the current trend will go on. In case 1.3663 is broken, the price could continue its move toward 1.3693.
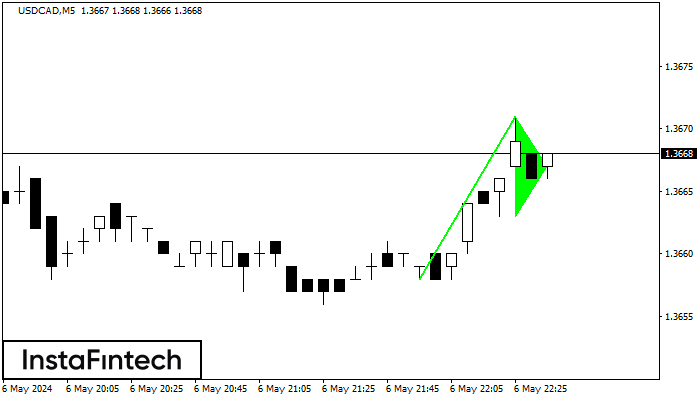
USDCAD M5
Bullish pennant
The Bullish pennant signal – Trading instrument USDCAD M5, continuation pattern. Forecast: it is possible to set up a buy position above the pattern’s high of 1.3671, with the prospect of the next move being a projection of the flagpole height.
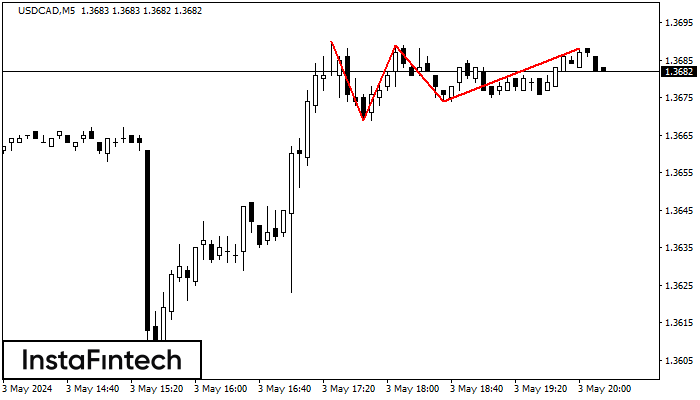
USDCAD M5
Triple Top
The Triple Top pattern has formed on the chart of the USDCAD M5. Features of the pattern: borders have an ascending angle; the lower line of the pattern has the coordinates 1.3669/1.3674 with the upper limit 1.3690/1.3688; the projection of the width is 21 points. The formation of the Triple Top figure most likely indicates a change in the trend from upward to downward. This means that in the event of a breakdown of the support level of 1.3669, the price is most likely to continue the downward movement.
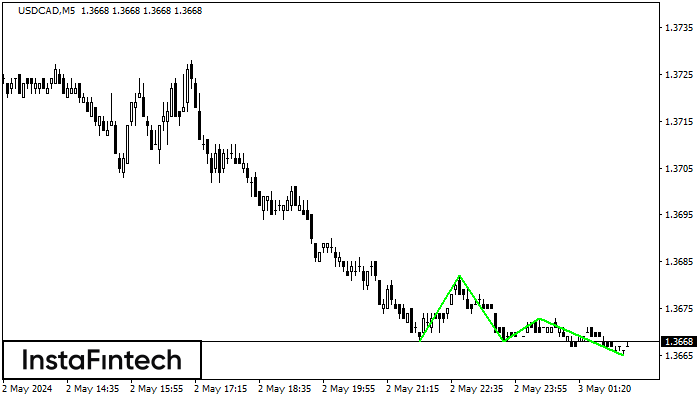
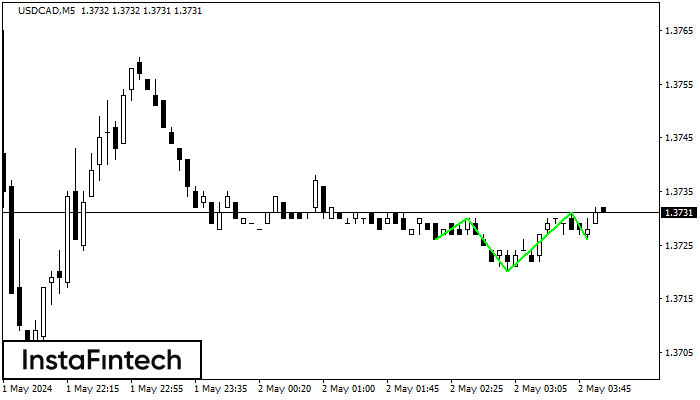
USDCAD M5
Triple Bottom
The Triple Bottom pattern has formed on the chart of the USDCAD M5 trading instrument. The pattern signals a change in the trend from downwards to upwards in the case of breakdown of 1.3682/1.3673.
USDCAD M30
Double Bottom
The Double Bottom pattern has been formed on USDCAD M30; the upper boundary is 1.3735; the lower boundary is 1.3704. The width of the pattern is 33 points. In case of a break of the upper boundary 1.3735, a change in the trend can be predicted where the width of the pattern will coincide with the distance to a possible take profit level.
USDCAD M5
Inverse Head and Shoulder
According to the chart of M5, USDCAD formed the Inverse Head and Shoulder pattern. The Head’s top is set at 1.3731 while the median line of the Neck is found at 1.3720/1.3726. The formation of the Inverse Head and Shoulder pattern evidently signals a reversal of the downward trend. In other words, in case the scenario comes true, the price of USDCAD will go towards 1.3746
USDCAD M5
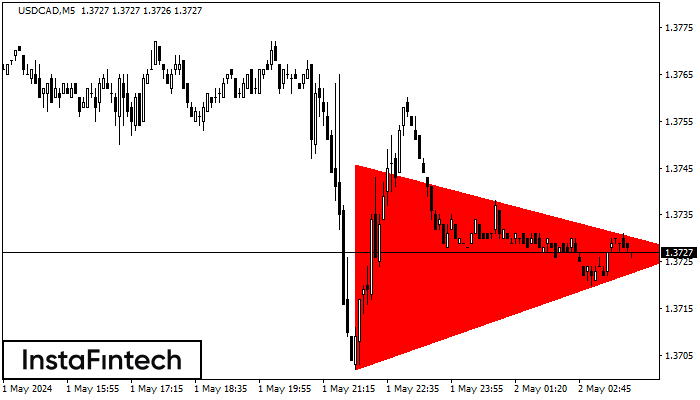
Bearish Symmetrical Triangle
According to the chart of M5, USDCAD formed the Bearish Symmetrical Triangle pattern. Description: The lower border is 1.3702/1.3727 and upper border is 1.3746/1.3727. The pattern width is measured on the chart at -44 pips. The formation of the Bearish Symmetrical Triangle pattern evidently signals a continuation of the downward trend. In other words, if the scenario comes true and USDCAD breaches the lower border, the price could continue its move toward 1.3712.
USDCAD M5
Triple Top
The Triple Top pattern has formed on the chart of the USDCAD M5. Features of the pattern: borders have an ascending angle; the lower line of the pattern has the coordinates 1.3767/1.3773 with the upper limit 1.3780/1.3782; the projection of the width is 13 points. The formation of the Triple Top figure most likely indicates a change in the trend from upward to downward. This means that in the event of a breakdown of the support level of 1.3767, the price is most likely to continue the downward movement.
USDCAD M5
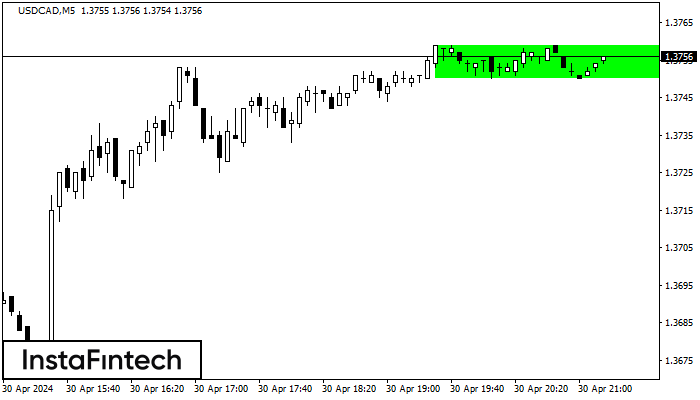
Bullish Rectangle
According to the chart of M5, USDCAD formed the Bullish Rectangle. This type of a pattern indicates a trend continuation. It consists of two levels: resistance 1.3759 and support 1.3750. In case the resistance level 1.3759 - 1.3759 is broken, the instrument is likely to follow the bullish trend.
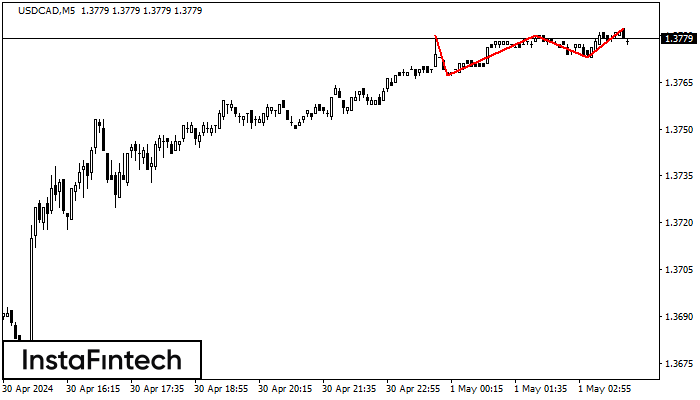
USDCAD M5
Triple Top
On the chart of the USDCAD M5 trading instrument, the Triple Top pattern that signals a trend change has formed. It is possible that after formation of the third peak, the price will try to break through the resistance level 1.3725, where we advise to open a trading position for sale. Take profit is the projection of the pattern’s width, which is 28 points.