 English
  Русский
 Bahasa Indonesia
 Bahasa Malay
 ไทย
ไทย Español
 Deutsch
 Български
 Français
 Tiếng Việt
 中文
中文 বাংলা
বাংলা हिन्दी
 Čeština
 Українська
 Română
FX.co ★ Patterns #PEP | PepsiCo, Inc. Stock Price

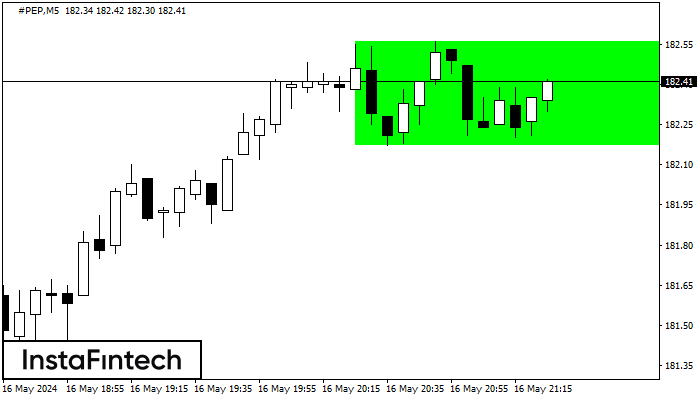
#PEP M5
Bullish Rectangle
According to the chart of M5, #PEP formed the Bullish Rectangle which is a pattern of a trend continuation. The pattern is contained within the following borders: the lower border 182.17 – 182.17 and upper border 182.56 – 182.56. In case the upper border is broken, the instrument is likely to follow the upward trend.

#PEP M15
Bearish Symmetrical Triangle
According to the chart of M15, #PEP formed the Bearish Symmetrical Triangle pattern. Description: The lower border is 178.58/179.78 and upper border is 180.85/179.78. The pattern width is measured on the chart at -227 pips. The formation of the Bearish Symmetrical Triangle pattern evidently signals a continuation of the downward trend. In other words, if the scenario comes true and #PEP breaches the lower border, the price could continue its move toward 179.55.
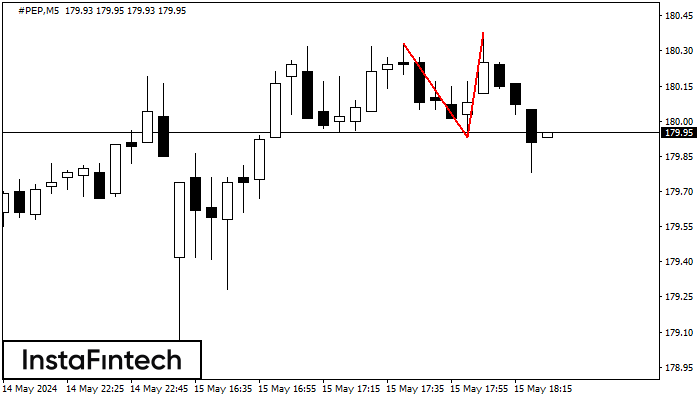
#PEP M5
Double Top
On the chart of #PEP M5 the Double Top reversal pattern has been formed. Characteristics: the upper boundary 180.38; the lower boundary 179.93; the width of the pattern 45 points. The signal: a break of the lower boundary will cause continuation of the downward trend targeting the 179.78 level.
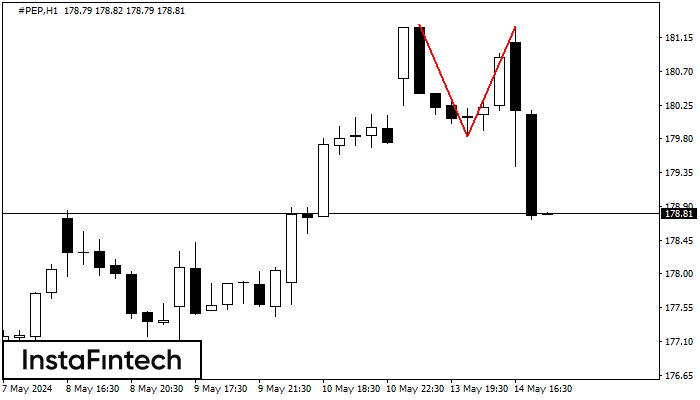
#PEP H1
Double Top
The Double Top pattern has been formed on #PEP H1. It signals that the trend has been changed from upwards to downwards. Probably, if the base of the pattern 179.83 is broken, the downward movement will continue.
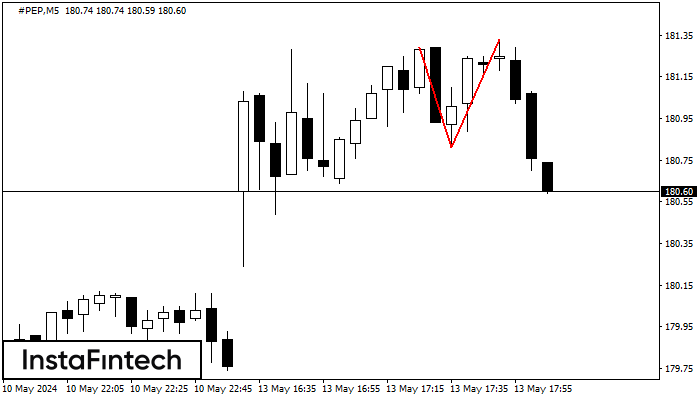
#PEP M5
Double Top
The Double Top reversal pattern has been formed on #PEP M5. Characteristics: the upper boundary 181.29; the lower boundary 180.81; the width of the pattern is 52 points. Sell trades are better to be opened below the lower boundary 180.81 with a possible movements towards the 180.66 level.
#PEP M5
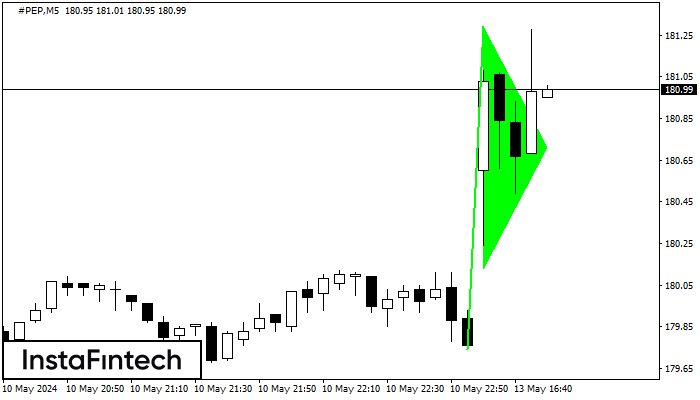
Bullish pennant
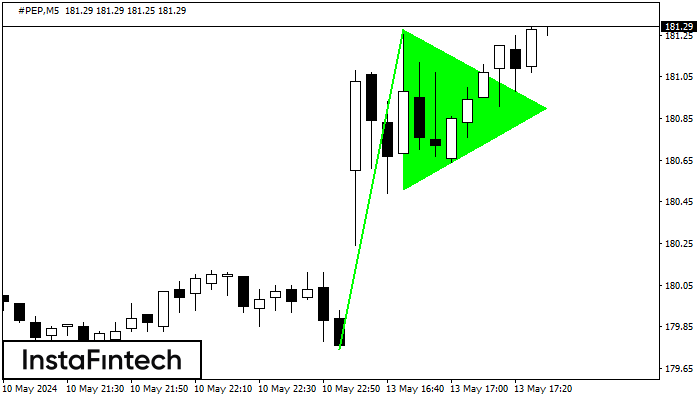
The Bullish pennant pattern is formed on the #PEP M5 chart. It is a type of the continuation pattern. Supposedly, in case the price is fixed above the pennant’s high of 181.28, a further uptrend is possible.
#PEP M5
Bullish pennant
The Bullish pennant graphic pattern has formed on the #PEP M5 instrument. This pattern type falls under the category of continuation patterns. In this case, if the quote can breaks out high, is expected to continue the upward trend to level 181.44.
#PEP M15
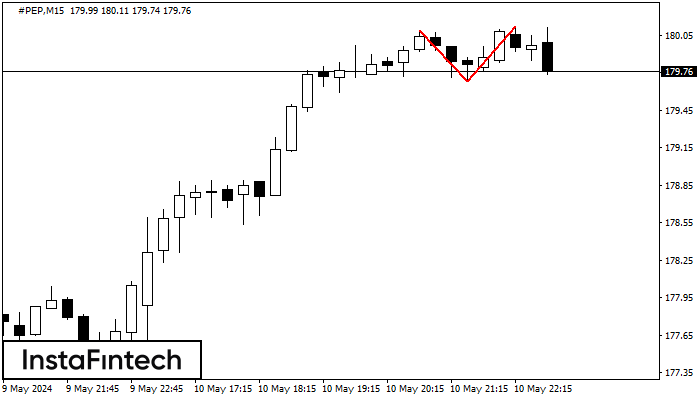
Double Top
On the chart of #PEP M15 the Double Top reversal pattern has been formed. Characteristics: the upper boundary 180.12; the lower boundary 179.68; the width of the pattern 44 points. The signal: a break of the lower boundary will cause continuation of the downward trend targeting the 179.46 level.
#PEP M5
Double Top
The Double Top pattern has been formed on #PEP M5. It signals that the trend has been changed from upwards to downwards. Probably, if the base of the pattern 179.85 is broken, the downward movement will continue.
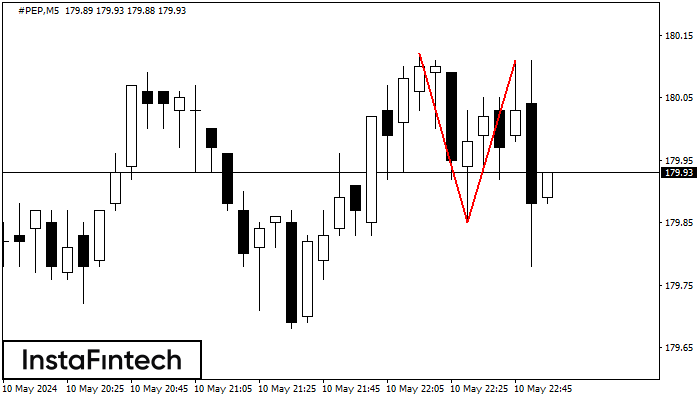
#PEP M5
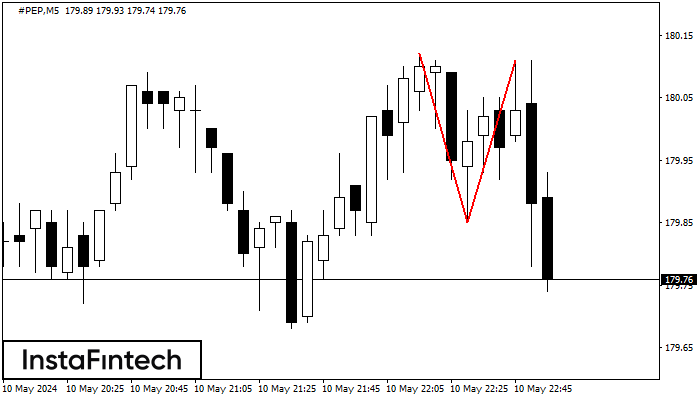
Double Top
The Double Top reversal pattern has been formed on #PEP M5. Characteristics: the upper boundary 180.12; the lower boundary 179.85; the width of the pattern is 26 points. Sell trades are better to be opened below the lower boundary 179.85 with a possible movements towards the 179.70 level.