 English
  Русский
 Bahasa Indonesia
 Bahasa Malay
 ไทย
ไทย Español
 Deutsch
 Български
 Français
 Tiếng Việt
 中文
中文 বাংলা
বাংলা हिन्दी
 Čeština
 Українська
 Română
FX.co ★ Patterns NZDUSD | New Zealand Dollar (NZD) to US Dollar (USD) Rate in the Forex market

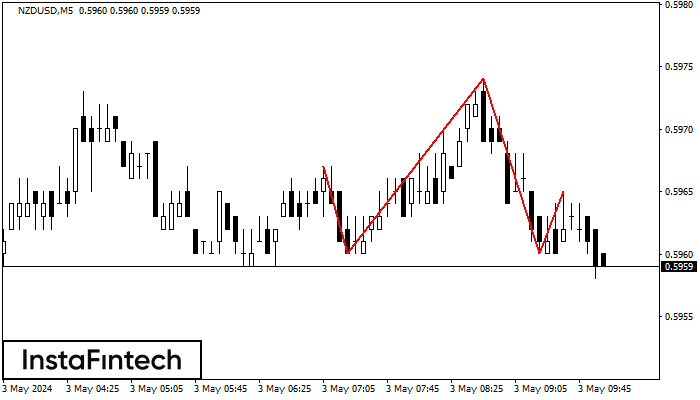
NZDUSD M5
Head and Shoulders
According to the chart of M5, NZDUSD formed the Head and Shoulders pattern. The Head’s top is set at 0.5974 while the median line of the Neck is found at 0.5960/0.5960. The formation of the Head and Shoulders pattern evidently signals a reversal of the upward trend. In other words, in case the scenario comes true, the price of NZDUSD will go towards 0.5945.
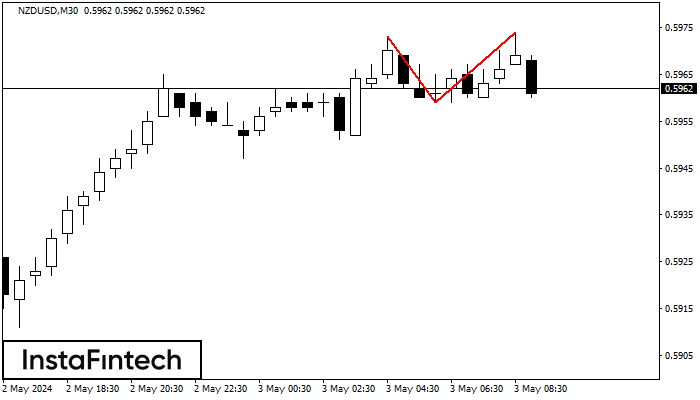
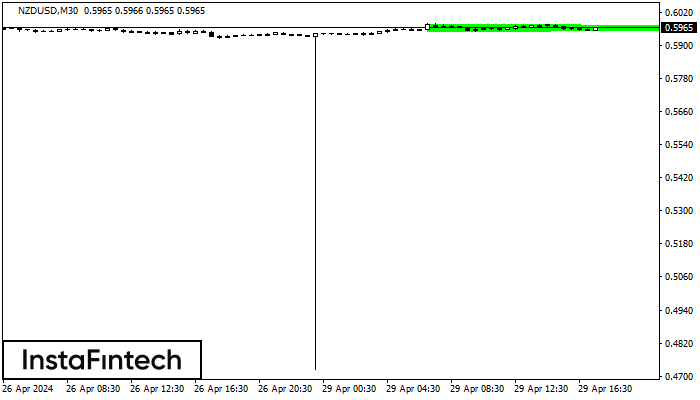
NZDUSD M30
Double Top
The Double Top reversal pattern has been formed on NZDUSD M30. Characteristics: the upper boundary 0.5973; the lower boundary 0.5959; the width of the pattern is 15 points. Sell trades are better to be opened below the lower boundary 0.5959 with a possible movements towards the 0.5929 level.
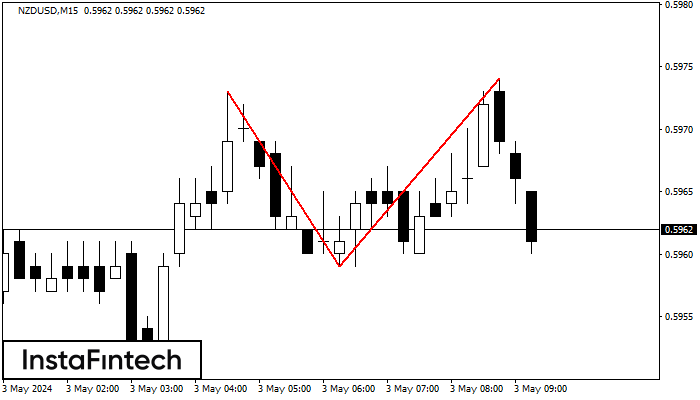
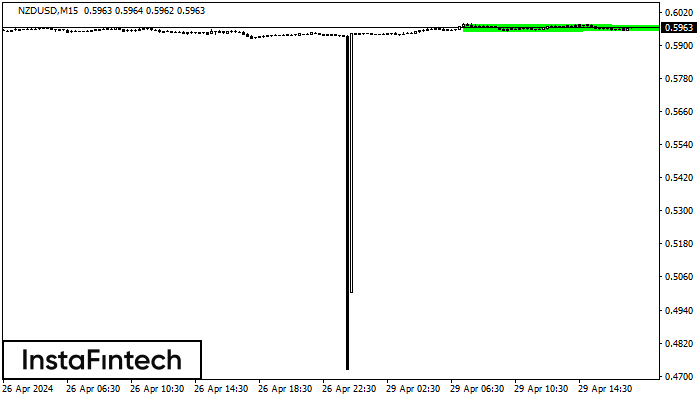
NZDUSD M15
Double Top
The Double Top pattern has been formed on NZDUSD M15. It signals that the trend has been changed from upwards to downwards. Probably, if the base of the pattern 0.5959 is broken, the downward movement will continue.
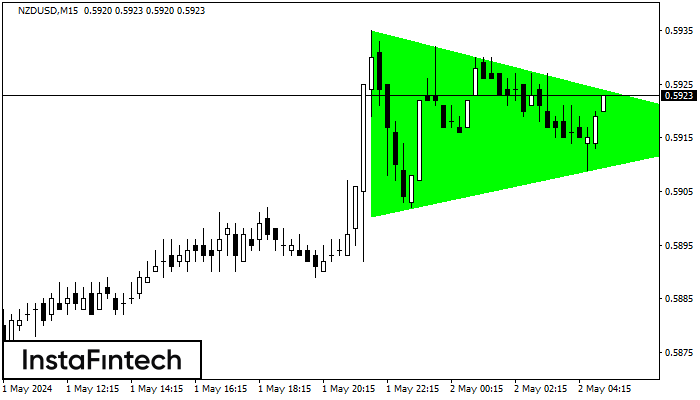
NZDUSD M15
Bullish Symmetrical Triangle
According to the chart of M15, NZDUSD formed the Bullish Symmetrical Triangle pattern, which signals the trend will continue. Description. The upper border of the pattern touches the coordinates 0.5935/0.5916 whereas the lower border goes across 0.5900/0.5916. The pattern width is measured on the chart at 35 pips. If the Bullish Symmetrical Triangle pattern is in progress during the upward trend, this indicates the current trend will go on. In case 0.5916 is broken, the price could continue its move toward 0.5939.
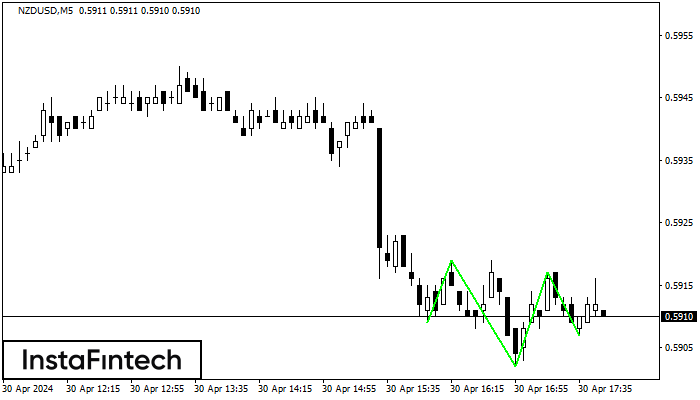
NZDUSD M5
Inverse Head and Shoulder
According to the chart of M5, NZDUSD formed the Inverse Head and Shoulder pattern. The Head’s top is set at 0.5917 while the median line of the Neck is found at 0.5902/0.5907. The formation of the Inverse Head and Shoulder pattern evidently signals a reversal of the downward trend. In other words, in case the scenario comes true, the price of NZDUSD will go towards 0.5932
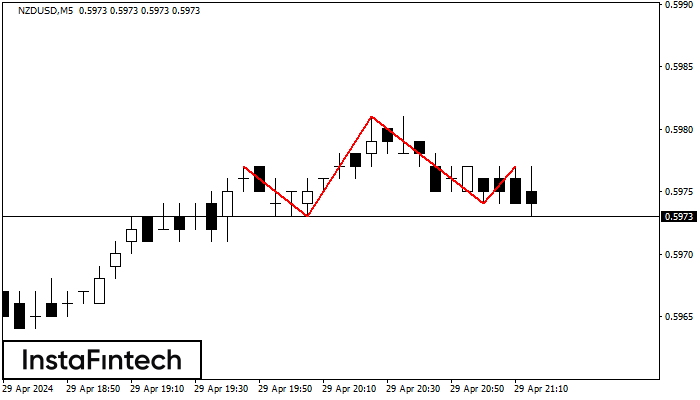
NZDUSD M5
Head and Shoulders
The technical pattern called Head and Shoulders has appeared on the chart of NZDUSD M5. There are weighty reasons to suggest that the price will surpass the Neckline 0.5973/0.5974 after the right shoulder has been formed. So, the trend is set to change with the price heading for 0.5959.
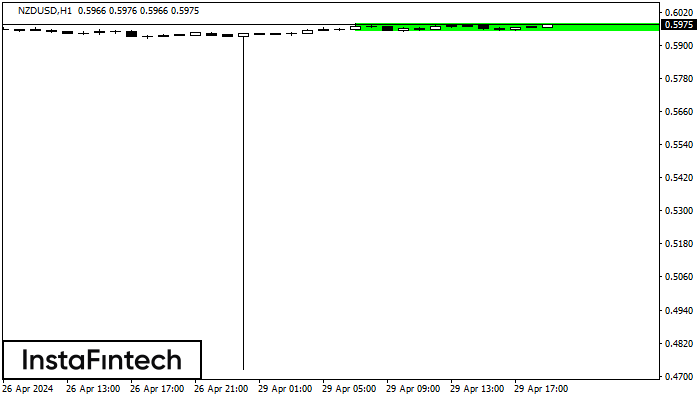
NZDUSD H1
Bullish Rectangle
According to the chart of H1, NZDUSD formed the Bullish Rectangle. The pattern indicates a trend continuation. The upper border is 0.5978, the lower border is 0.5952. The signal means that a long position should be opened above the upper border 0.5978 of the Bullish Rectangle.
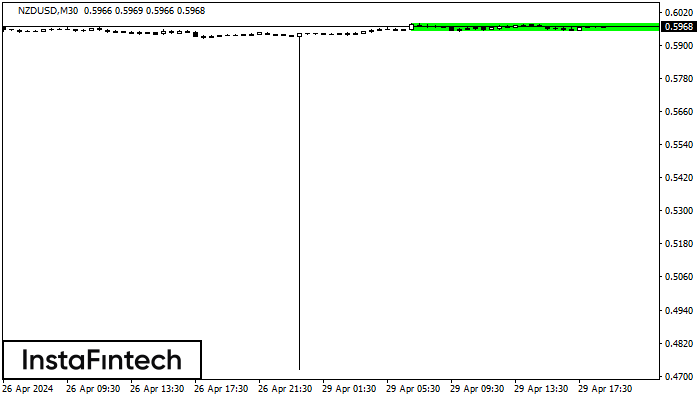
NZDUSD M30
Bullish Rectangle
According to the chart of M30, NZDUSD formed the Bullish Rectangle. This type of a pattern indicates a trend continuation. It consists of two levels: resistance 0.5978 and support 0.5952. In case the resistance level 0.5978 - 0.5978 is broken, the instrument is likely to follow the bullish trend.
NZDUSD M30
Bullish Symmetrical Triangle
According to the chart of M30, NZDUSD formed the Bullish Symmetrical Triangle pattern, which signals the trend will continue. Description. The upper border of the pattern touches the coordinates 0.5978/0.5963 whereas the lower border goes across 0.5951/0.5963. The pattern width is measured on the chart at 27 pips. If the Bullish Symmetrical Triangle pattern is in progress during the upward trend, this indicates the current trend will go on. In case 0.5963 is broken, the price could continue its move toward 0.5993.
NZDUSD M15
Bullish Symmetrical Triangle
According to the chart of M15, NZDUSD formed the Bullish Symmetrical Triangle pattern, which signals the trend will continue. Description. The upper border of the pattern touches the coordinates 0.5978/0.5963 whereas the lower border goes across 0.5951/0.5963. The pattern width is measured on the chart at 27 pips. If the Bullish Symmetrical Triangle pattern is in progress during the upward trend, this indicates the current trend will go on. In case 0.5963 is broken, the price could continue its move toward 0.5986.