 English
  Русский
 Bahasa Indonesia
 Bahasa Malay
 ไทย
ไทย Español
 Deutsch
 Български
 Français
 Tiếng Việt
 中文
中文 বাংলা
বাংলা हिन्दी
 Čeština
 Українська
 Română
FX.co ★ Patterns #NTDOY | Nintendo Co., Ltd. Stock Price

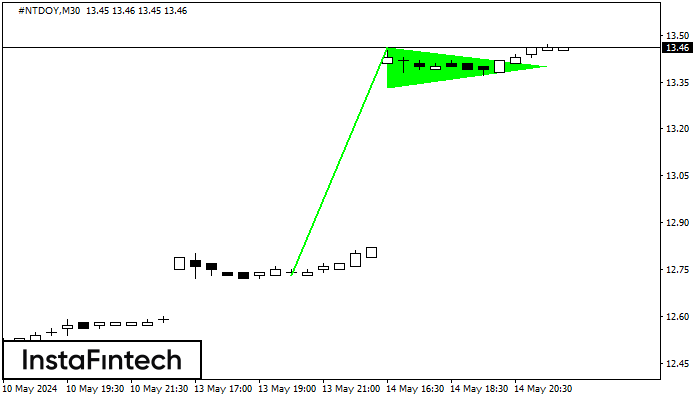
#NTDOY M30
Bullish pennant
The Bullish pennant signal – Trading instrument #NTDOY M30, continuation pattern. Forecast: it is possible to set up a buy position above the pattern’s high of 13.46, with the prospect of the next move being a projection of the flagpole height.
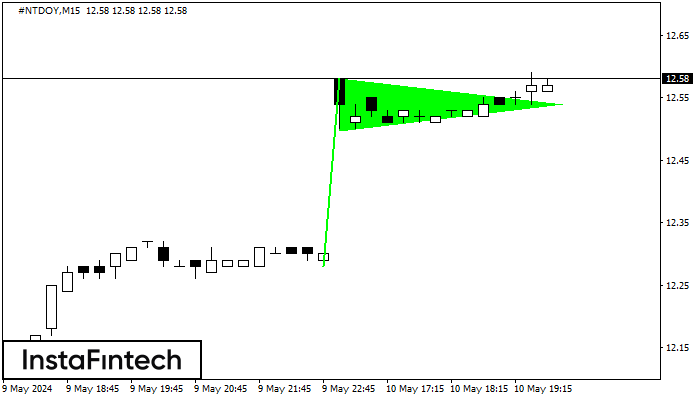
#NTDOY M15
Bullish pennant
The Bullish pennant signal – Trading instrument #NTDOY M15, continuation pattern. Forecast: it is possible to set up a buy position above the pattern’s high of 12.58, with the prospect of the next move being a projection of the flagpole height.
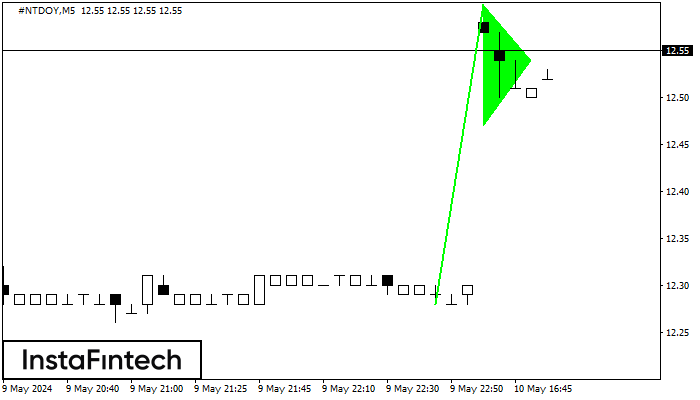
#NTDOY M5
Bullish pennant
The Bullish pennant graphic pattern has formed on the #NTDOY M5 instrument. This pattern type falls under the category of continuation patterns. In this case, if the quote can breaks out high, is expected to continue the upward trend to level 12.75.
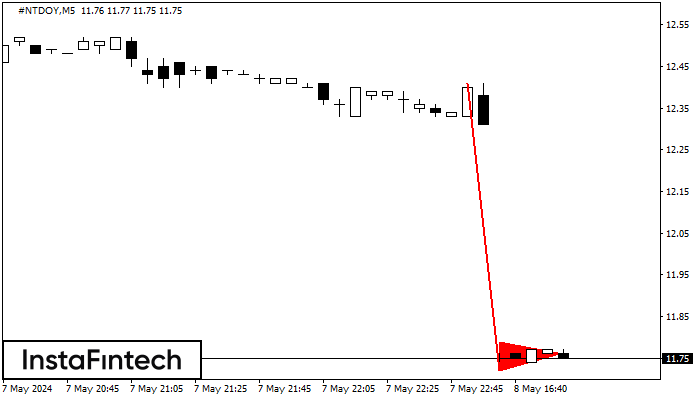
#NTDOY M5
Bearish pennant
The Bearish pennant pattern has formed on the #NTDOY M5 chart. It signals potential continuation of the existing trend. Specifications: the pattern’s bottom has the coordinate of 11.72; the projection of the flagpole height is equal to 69 pips. In case the price breaks out the pattern’s bottom of 11.72, the downtrend is expected to continue for further level 11.57.
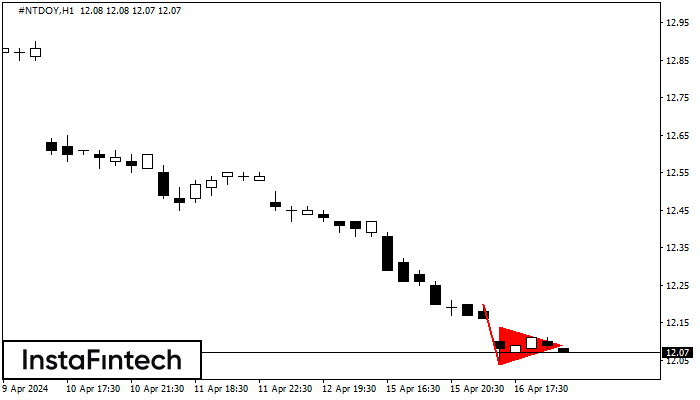
#NTDOY H1
Bearish pennant
The Bearish pennant pattern has formed on the #NTDOY H1 chart. It signals potential continuation of the existing trend. Specifications: the pattern’s bottom has the coordinate of 12.04; the projection of the flagpole height is equal to 16 pips. In case the price breaks out the pattern’s bottom of 12.04, the downtrend is expected to continue for further level 11.64.
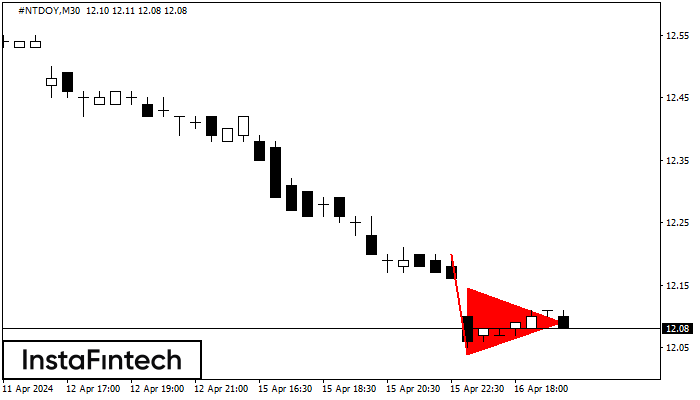
#NTDOY M30
Bearish pennant
The Bearish pennant pattern has formed on the #NTDOY M30 chart. This pattern type is characterized by a slight slowdown after which the price will move in the direction of the original trend. In case the price fixes below the pattern’s low of 12.04, a trader will be able to successfully enter the sell position.
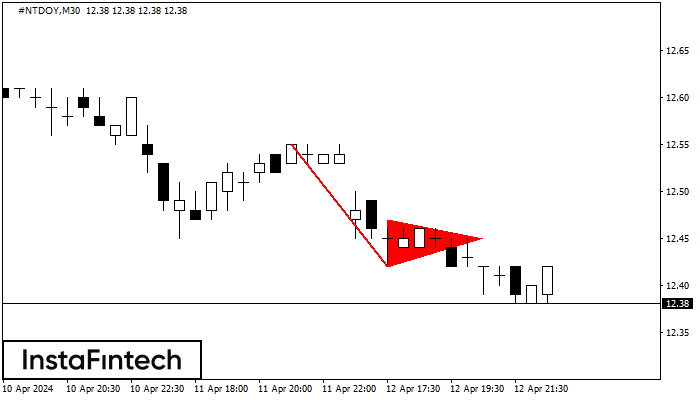
#NTDOY M30
Bearish pennant
The Bearish pennant pattern has formed on the #NTDOY M30 chart. The pattern signals continuation of the downtrend in case the pennant’s low of 12.42 is broken through. Recommendations: Place the sell stop pending order 10 pips below the pattern’s low. Place the take profit order at the projection distance of the flagpole height.
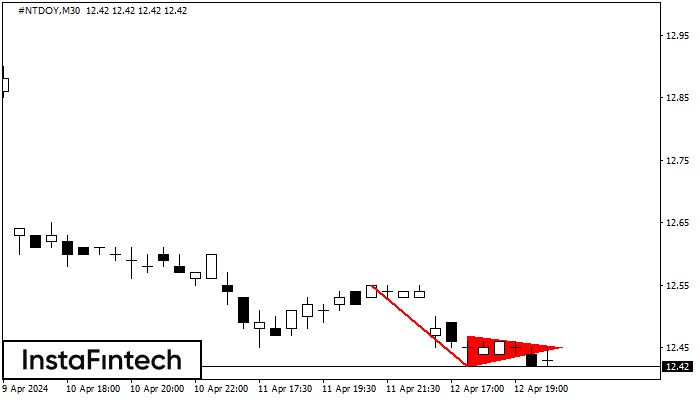
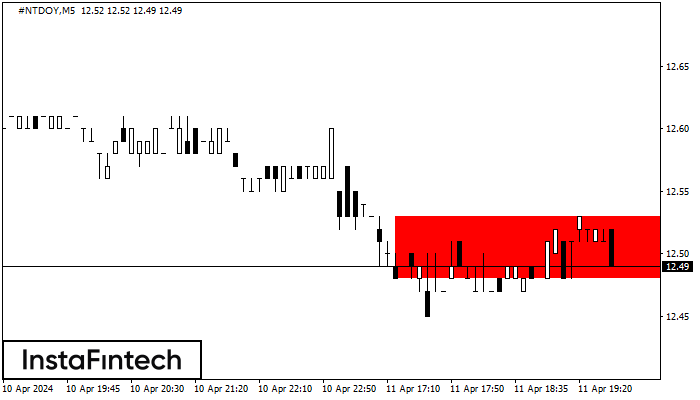
#NTDOY M5
Bearish Rectangle
According to the chart of M5, #NTDOY formed the Bearish Rectangle. This type of a pattern indicates a trend continuation. It consists of two levels: resistance 12.53 - 0.00 and support 12.48 – 12.48. In case the resistance level 12.48 - 12.48 is broken, the instrument is likely to follow the bearish trend.
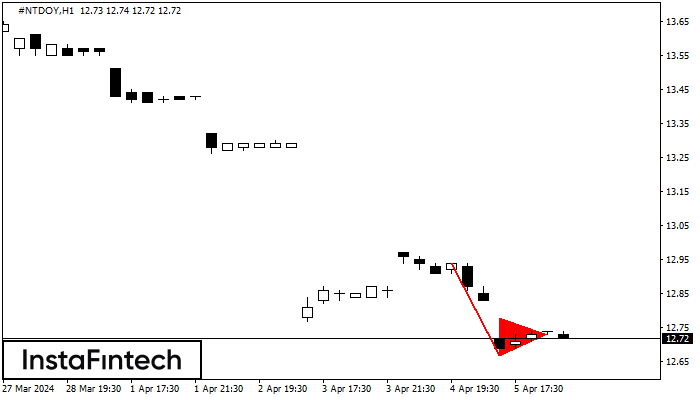
#NTDOY H1
Bearish pennant
The Bearish pennant pattern has formed on the #NTDOY H1 chart. This pattern type is characterized by a slight slowdown after which the price will move in the direction of the original trend. In case the price fixes below the pattern’s low of 12.67, a trader will be able to successfully enter the sell position.