 English
  Русский
 Bahasa Indonesia
 Bahasa Malay
 ไทย
ไทย Español
 Deutsch
 Български
 Français
 Tiếng Việt
 中文
中文 বাংলা
বাংলা हिन्दी
 Čeština
 Українська
 Română
FX.co ★ Analytics #NDX | NASDAQ 100 Index Stock Price

Forex Analysis
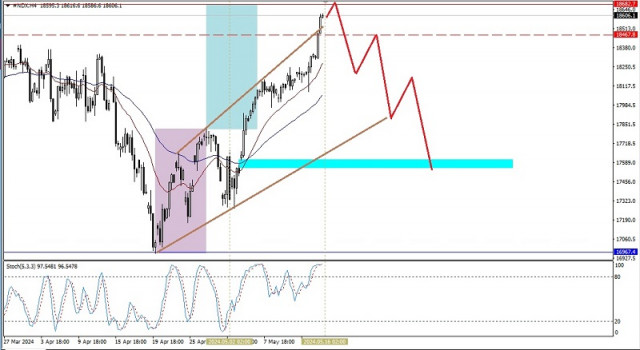
Technical Analysis of Intraday Price Movement of Nasdaq 100 Index, Thursday May 16 2024.
Even though currently on the 4-hour chart the Nasdaq 100 index appears to be in a strengthening condition, which is confirmed by the EMA 20 which is above...
 Relevance until2024-05-17
Analytical expert:
2024-05-16
Forex Analysis
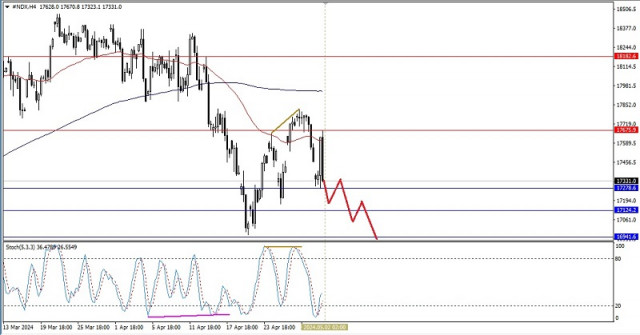
Technical Analysis of Intraday Price Movement of Nasdaq 100 Index, Thursday May 02 2024.
With the appearance of deviations between the price movement of the Nasdaq 100 index and the Stochastic Oscillator indicator plus the condition of the MA 50 which is below...
Relevance until2024-05-03Analytical expert:
2024-05-02
Forex Analysis
Technical Analysis of Intraday Price Movement of Nasdaq 100 Index, Thursday April 18 2024.
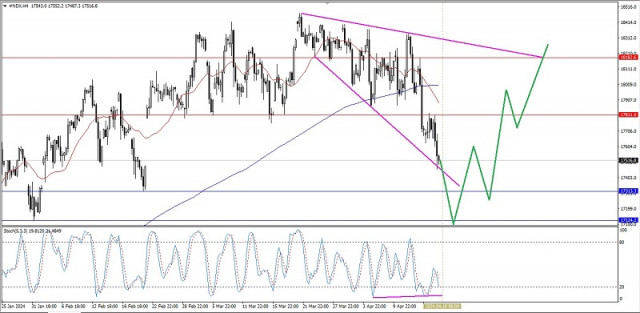
Even though currently on the 4-hour chart the Nasdaq 100 index has a Death Cross crossing between the 50 and 200 MAs, the appearance of the Descending Broadening Wedge pattern...
Relevance until2024-04-19Analytical expert:
2024-04-18
Forex Analysis
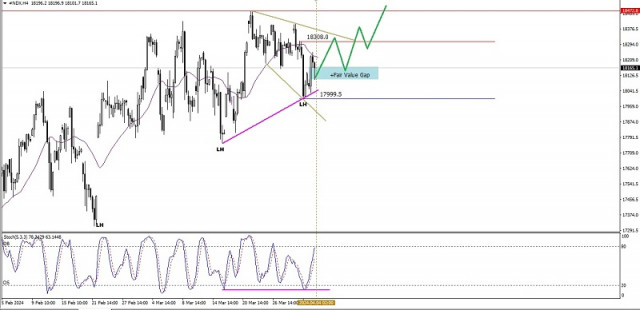
Technical Analysis of Intraday Price Movement of Nasdaq 100 Index, Thursday April 04 2024.
If we look at the 4-hour chart of the Nasdaq 100 index, it can be seen that Buyers still dominate, which can be seen from the price movement which formed...
Relevance until2024-04-05Analytical expert:
2024-04-04
Forex Analysis
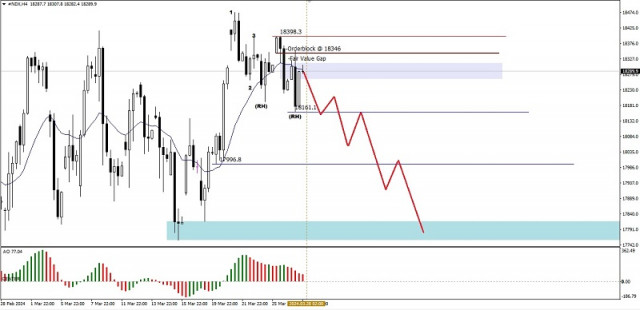
Technical Analysis of Intraday Price Movement of Nasdaq 100 Index, Thursday March 28 2024.
Although on the 4 hour chart of Nasdaq 100 index is moving sideways and ranging, but with the price movement breaking down WMA 20 Shift 2 followed by the appearance...
Relevance until2024-03-29Analytical expert:
2024-03-28
Forex Analysis
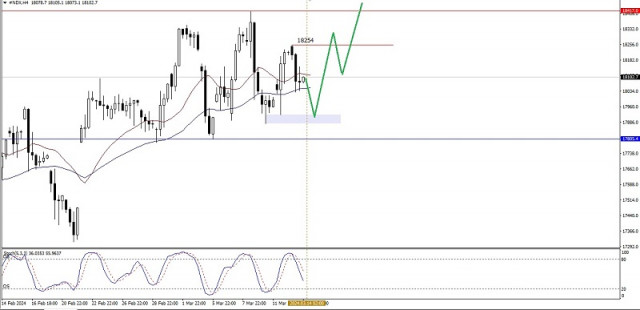
Technical Analysis of Intraday Price Movement of Nasdaq 100 Index, Thursday March 21 2024.
On the 4 hours index of Nasdaq 100 recently, there is Buyers who are still dominates where this is confirmed by the condition of its Golden Cross, MA 50 above...
Relevance until2024-03-22Analytical expert:
2024-03-21
Forex Analysis
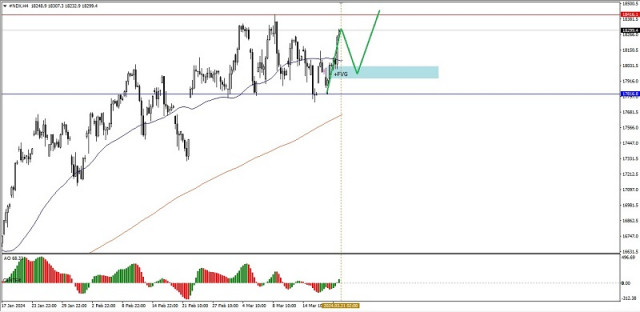
Technical Analysis of Intraday Price Movement of Nasdaq 100 Index, Thursday March 14 2024.
If we look at the 4-hour chart of the Nasdaq 100 index, we can see that the 20 EMA is still above the 50 EMA (Golden Cross), which indicates that...
Relevance until2024-03-15Analytical expert:
2024-03-14
Forex Analysis
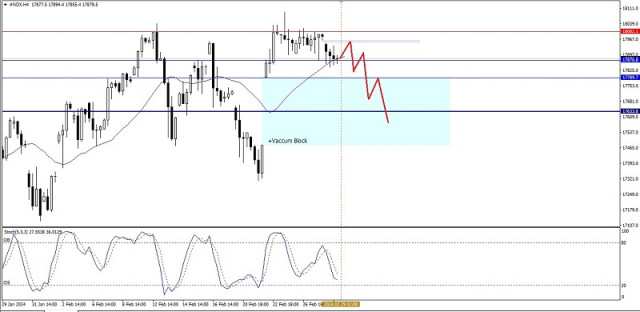
Technical Analysis of Intraday Price Movement of Nasdaq 100 Index, Thursday February 29 2024.
With the restraint of Nasdaq 100 index on Resistance level 18002,1, then #NDX has the potential to weaken down to trying to break below the level of 17870,8...
Relevance until2024-03-01Analytical expert:
2024-02-29
Forex Analysis
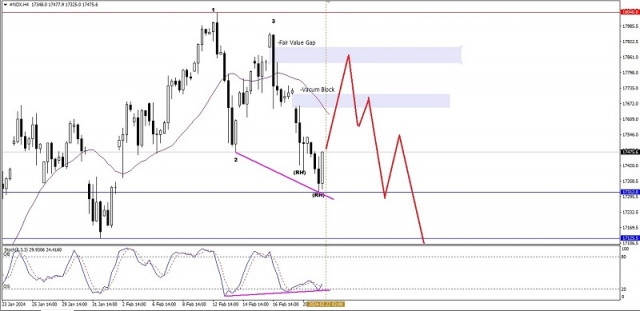
Technical Analysis of Intraday Price Movement of Nasdaq 100 Index, Thursday February 22 2024.
If we look at the 4-hour chart of the Nasdaq 100 index, we can see the emergence of a Bearish 123 pattern followed by several Bearish Ross Hooks (RH), which...
Relevance until2024-02-23Analytical expert:
2024-02-22
Forex Analysis
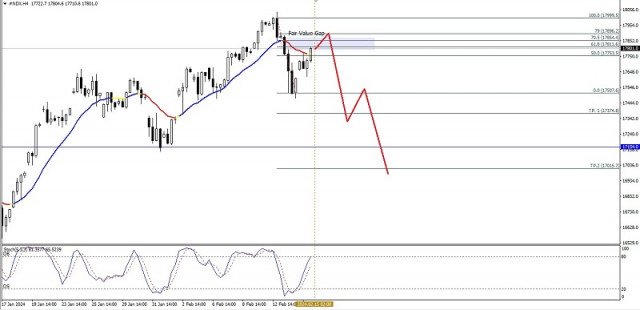
Technical Analysis of Intraday Price Movement of Nasdaq 100 Index, Thursday February 15 2024.
If we look at the 4-hour chart of the Nasdaq 100 index, it can be seen that the Stochastic Oscillator indicator is approaching entering the Overbought region...
Relevance until2024-02-16Analytical expert:
2024-02-15