 English
  Русский
 Bahasa Indonesia
 Bahasa Malay
 ไทย
ไทย Español
 Deutsch
 Български
 Français
 Tiếng Việt
 中文
中文 বাংলা
বাংলা हिन्दी
 Čeština
 Українська
 Română
FX.co ★ Patterns #MCD | McDonald's Corporation Stock Price

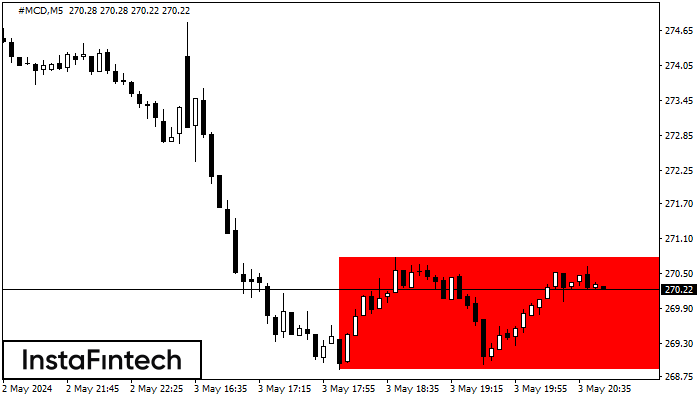
#MCD M5
Bearish Rectangle
According to the chart of M5, #MCD formed the Bearish Rectangle which is a pattern of a trend continuation. The pattern is contained within the following borders: lower border 268.87 – 268.87 and upper border 270.78 – 270.78. In case the lower border is broken, the instrument is likely to follow the downward trend.
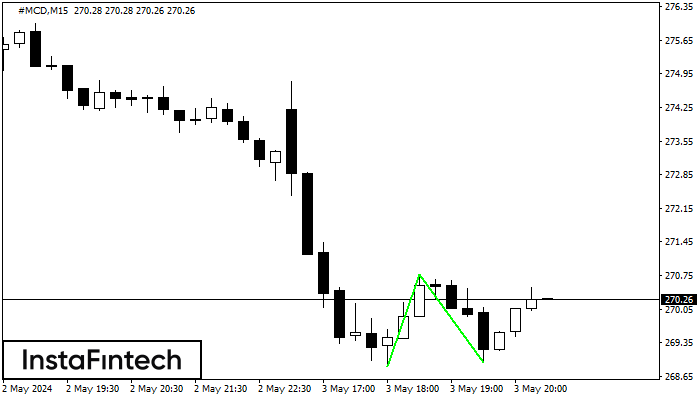
#MCD M15
Double Bottom
The Double Bottom pattern has been formed on #MCD M15. Characteristics: the support level 268.87; the resistance level 270.78; the width of the pattern 191 points. If the resistance level is broken, a change in the trend can be predicted with the first target point lying at the distance of 184 points.
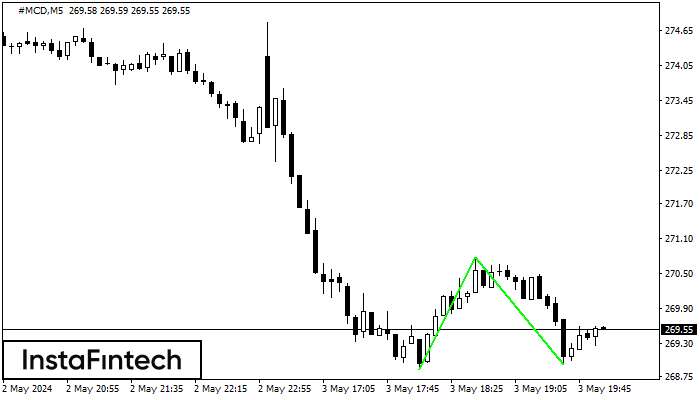
#MCD M5
Double Bottom
The Double Bottom pattern has been formed on #MCD M5; the upper boundary is 270.78; the lower boundary is 268.94. The width of the pattern is 191 points. In case of a break of the upper boundary 270.78, a change in the trend can be predicted where the width of the pattern will coincide with the distance to a possible take profit level.
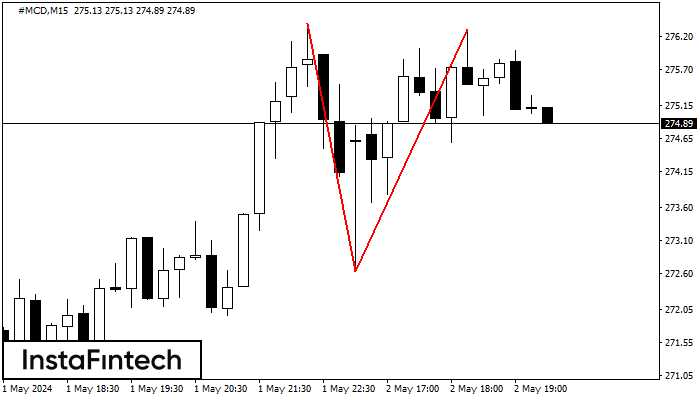
#MCD M15
Double Top
The Double Top reversal pattern has been formed on #MCD M15. Characteristics: the upper boundary 276.41; the lower boundary 272.64; the width of the pattern is 367 points. Sell trades are better to be opened below the lower boundary 272.64 with a possible movements towards the 272.42 level.
#MCD M5
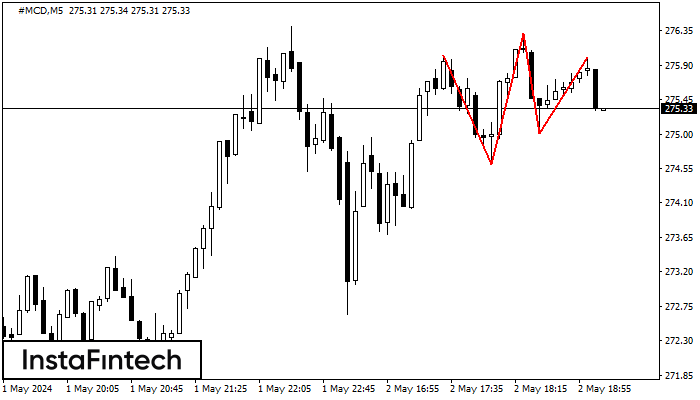
Triple Top
The Triple Top pattern has formed on the chart of the #MCD M5 trading instrument. It is a reversal pattern featuring the following characteristics: resistance level 3, support level -41, and pattern’s width 143. Forecast If the price breaks through the support level 274.60, it is likely to move further down to 276.16.
#MCD M5
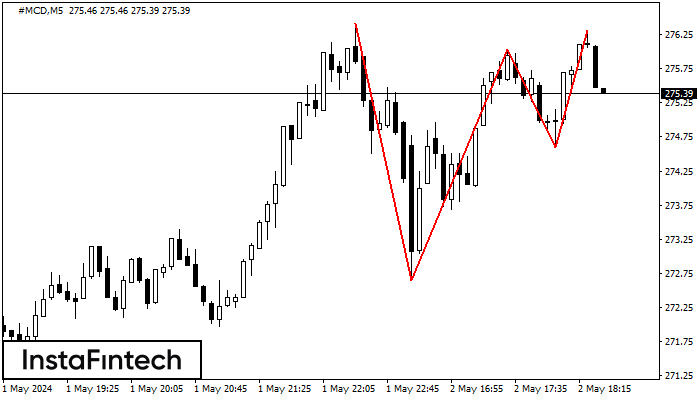
Triple Top
The Triple Top pattern has formed on the chart of the #MCD M5. Features of the pattern: borders have an ascending angle; the lower line of the pattern has the coordinates 272.64/274.60 with the upper limit 276.41/276.31; the projection of the width is 377 points. The formation of the Triple Top figure most likely indicates a change in the trend from upward to downward. This means that in the event of a breakdown of the support level of 272.64, the price is most likely to continue the downward movement.
#MCD M5
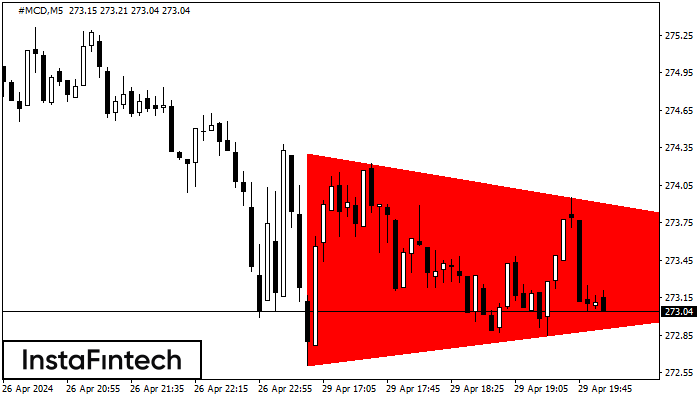
Bearish Symmetrical Triangle
According to the chart of M5, #MCD formed the Bearish Symmetrical Triangle pattern. This pattern signals a further downward trend in case the lower border 272.61 is breached. Here, a hypothetical profit will equal the width of the available pattern that is -170 pips.
#MCD M5
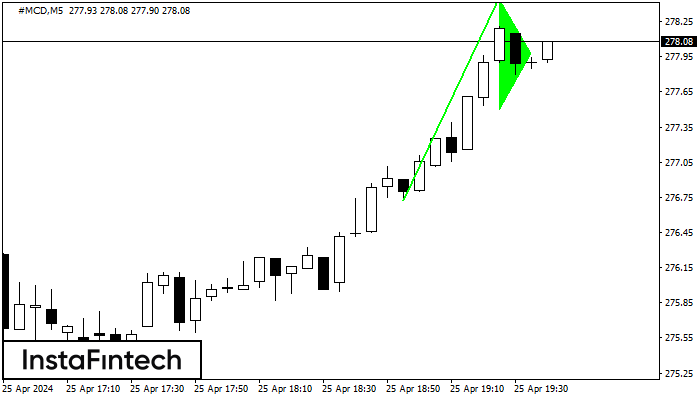
Bullish pennant
The Bullish pennant signal – Trading instrument #MCD M5, continuation pattern. Forecast: it is possible to set up a buy position above the pattern’s high of 278.45, with the prospect of the next move being a projection of the flagpole height.
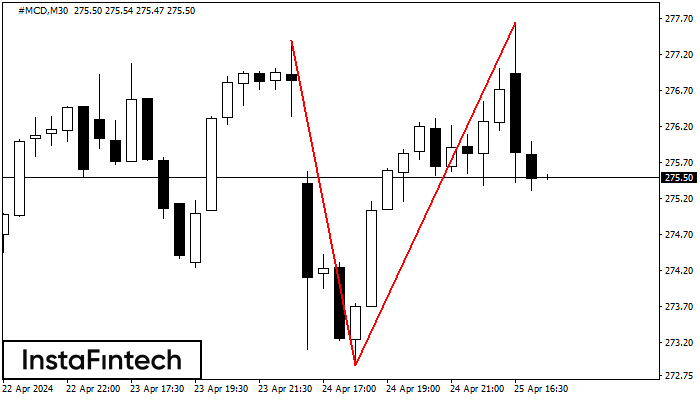
#MCD M30
Double Top
The Double Top reversal pattern has been formed on #MCD M30. Characteristics: the upper boundary 277.40; the lower boundary 272.89; the width of the pattern is 476 points. Sell trades are better to be opened below the lower boundary 272.89 with a possible movements towards the 272.59 level.
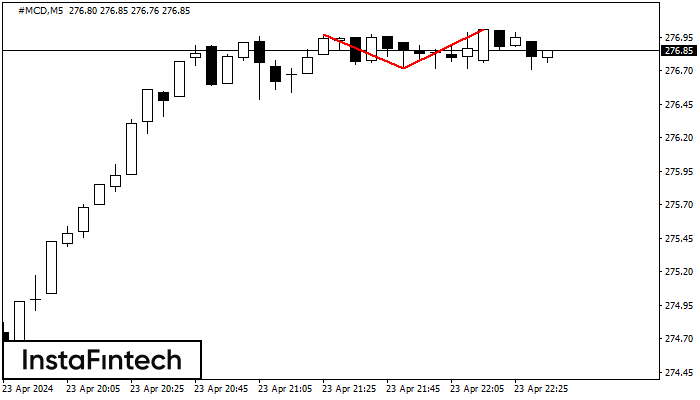
#MCD M5
Double Top
The Double Top pattern has been formed on #MCD M5. It signals that the trend has been changed from upwards to downwards. Probably, if the base of the pattern 276.72 is broken, the downward movement will continue.