 English
  Русский
 Bahasa Indonesia
 Bahasa Malay
 ไทย
ไทย Español
 Deutsch
 Български
 Français
 Tiếng Việt
 中文
中文 বাংলা
বাংলা हिन्दी
 Čeština
 Українська
 Română
FX.co ★ Patterns #INTC | Intel Corporation Stock Price

#INTC M5
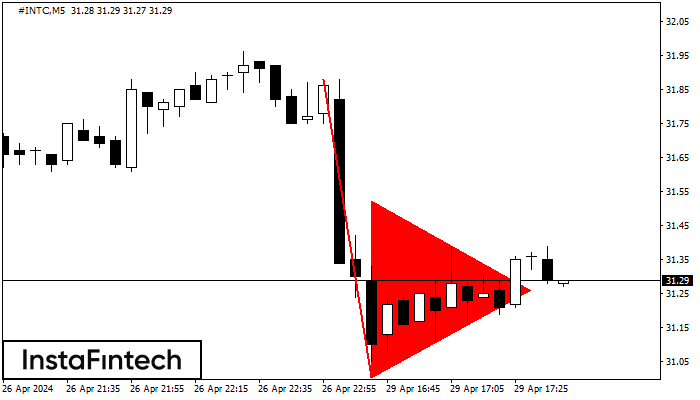
Bearish pennant
The Bearish pennant pattern has formed on the #INTC M5 chart. This pattern type is characterized by a slight slowdown after which the price will move in the direction of the original trend. In case the price fixes below the pattern’s low of 31.00, a trader will be able to successfully enter the sell position.
#INTC M5
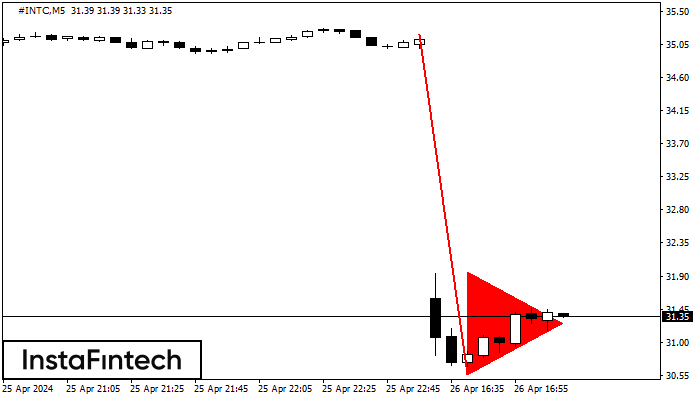
Bearish pennant
The Bearish pennant pattern has formed on the #INTC M5 chart. It signals potential continuation of the existing trend. Specifications: the pattern’s bottom has the coordinate of 30.56; the projection of the flagpole height is equal to 462 pips. In case the price breaks out the pattern’s bottom of 30.56, the downtrend is expected to continue for further level 30.41.
#INTC M5
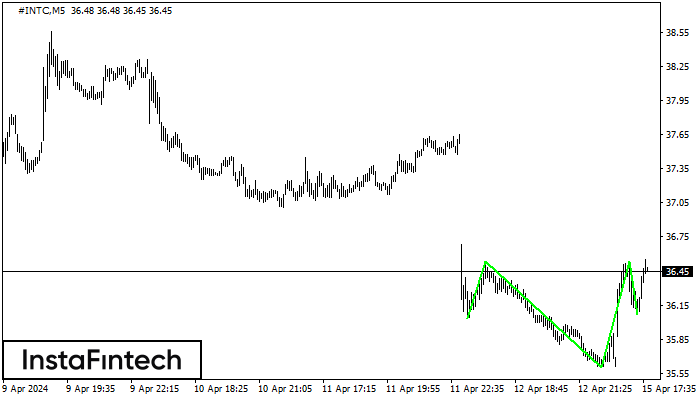
Inverse Head and Shoulder
According to M5, #INTC is shaping the technical pattern – the Inverse Head and Shoulder. In case the Neckline 36.53/36.53 is broken out, the instrument is likely to move toward 36.68.
#INTC M5
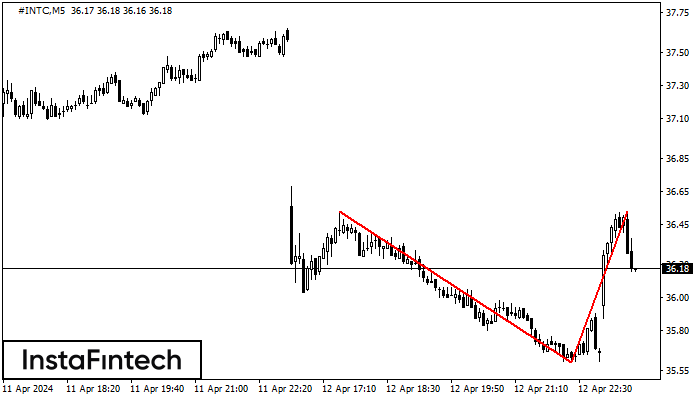
Double Top
The Double Top pattern has been formed on #INTC M5. It signals that the trend has been changed from upwards to downwards. Probably, if the base of the pattern 35.60 is broken, the downward movement will continue.
#INTC M5
Bearish pennant
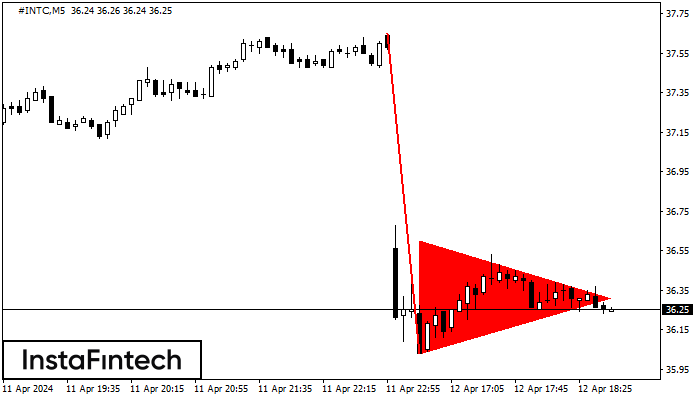
The Bearish pennant pattern has formed on the #INTC M5 chart. The pattern signals continuation of the downtrend in case the pennant’s low of 36.03 is broken through. Recommendations: Place the sell stop pending order 10 pips below the pattern’s low. Place the take profit order at the projection distance of the flagpole height.
#INTC M5
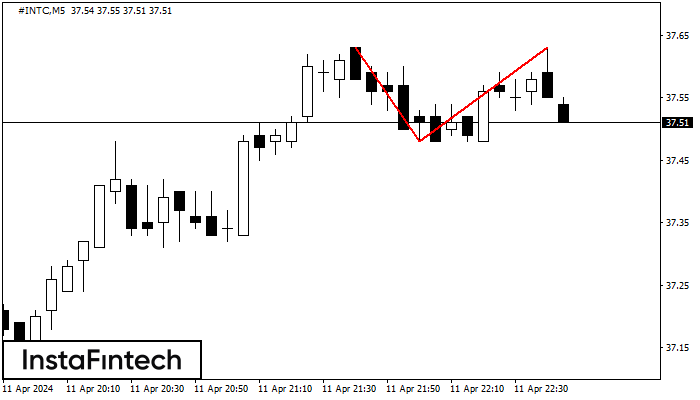
Double Top
The Double Top reversal pattern has been formed on #INTC M5. Characteristics: the upper boundary 37.63; the lower boundary 37.48; the width of the pattern is 15 points. Sell trades are better to be opened below the lower boundary 37.48 with a possible movements towards the 37.33 level.
#INTC M30
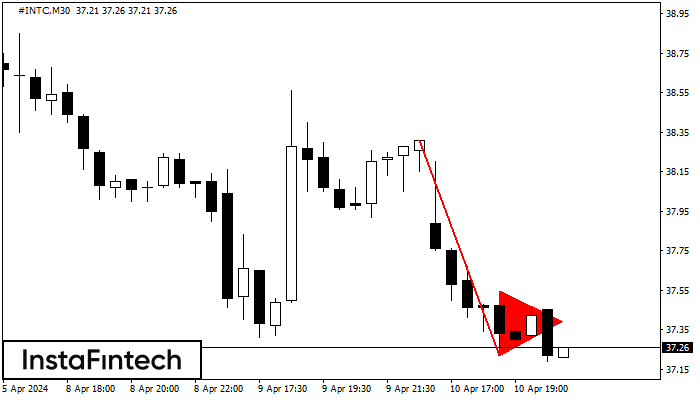
Bearish pennant
The Bearish pennant pattern has formed on the #INTC M30 chart. It signals potential continuation of the existing trend. Specifications: the pattern’s bottom has the coordinate of 37.22; the projection of the flagpole height is equal to 109 pips. In case the price breaks out the pattern’s bottom of 37.22, the downtrend is expected to continue for further level 36.92.
#INTC H1
Bearish pennant
The Bearish pennant pattern has formed on the #INTC H1 chart. This pattern type is characterized by a slight slowdown after which the price will move in the direction of the original trend. In case the price fixes below the pattern’s low of 37.84, a trader will be able to successfully enter the sell position.
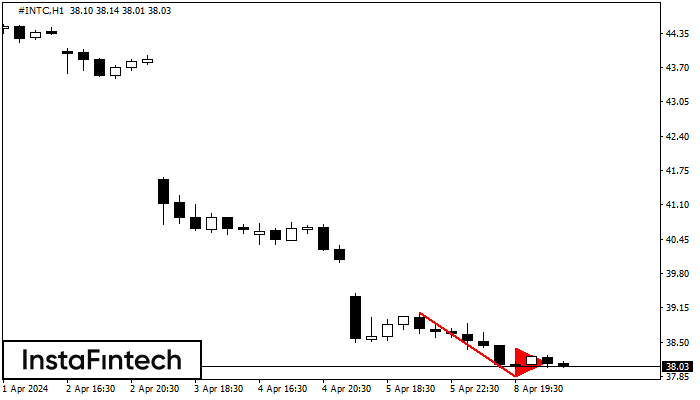
#INTC H1
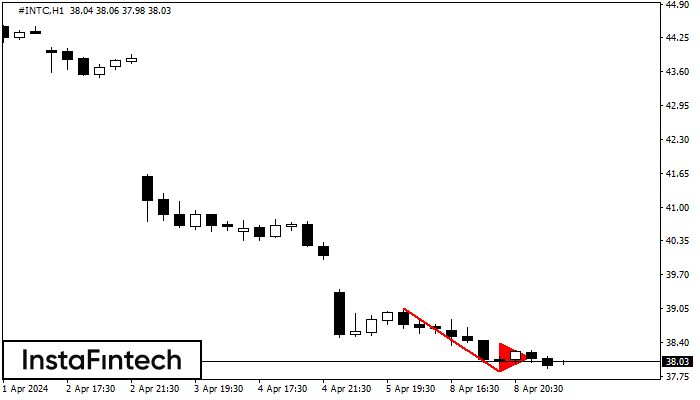
Bearish pennant
The Bearish pennant pattern has formed on the #INTC H1 chart. The pattern signals continuation of the downtrend in case the pennant’s low of 37.84 is broken through. Recommendations: Place the sell stop pending order 10 pips below the pattern’s low. Place the take profit order at the projection distance of the flagpole height.
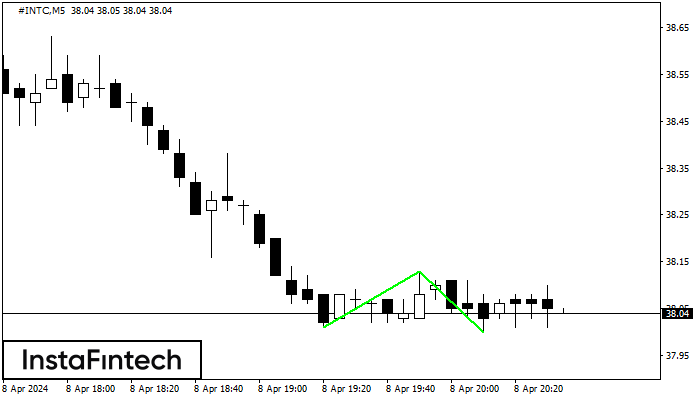
#INTC M5
Double Bottom
The Double Bottom pattern has been formed on #INTC M5. This formation signals a reversal of the trend from downwards to upwards. The signal is that a buy trade should be opened after the upper boundary of the pattern 38.13 is broken. The further movements will rely on the width of the current pattern 12 points.