 English
  Русский
 Bahasa Indonesia
 Bahasa Malay
 ไทย
ไทย Español
 Deutsch
 Български
 Français
 Tiếng Việt
 中文
中文 বাংলা
বাংলা हिन्दी
 Čeština
 Українська
 Română
FX.co ★ Patterns GOLD | Gold Rate in the Forex market

GOLD M5
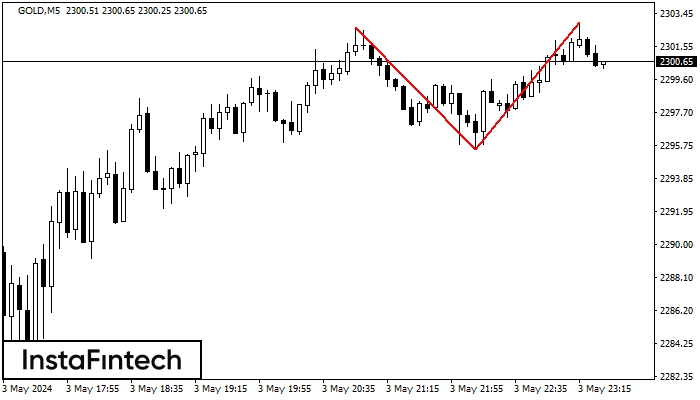
Double Top
The Double Top pattern has been formed on GOLD M5. It signals that the trend has been changed from upwards to downwards. Probably, if the base of the pattern 2295.56 is broken, the downward movement will continue.
GOLD M5
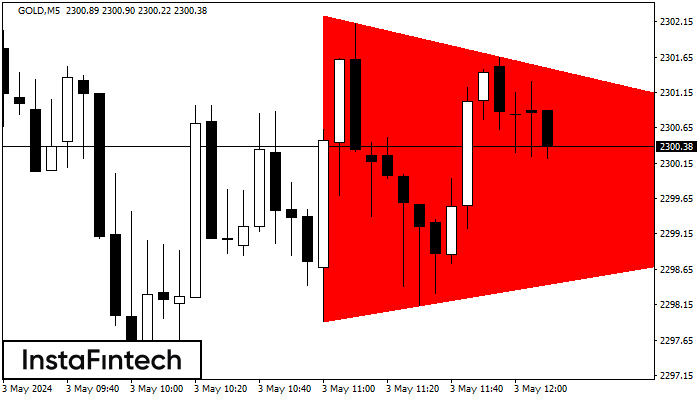
Bearish Symmetrical Triangle
According to the chart of M5, GOLD formed the Bearish Symmetrical Triangle pattern. This pattern signals a further downward trend in case the lower border 2297.91 is breached. Here, a hypothetical profit will equal the width of the available pattern that is -433 pips.
GOLD M5
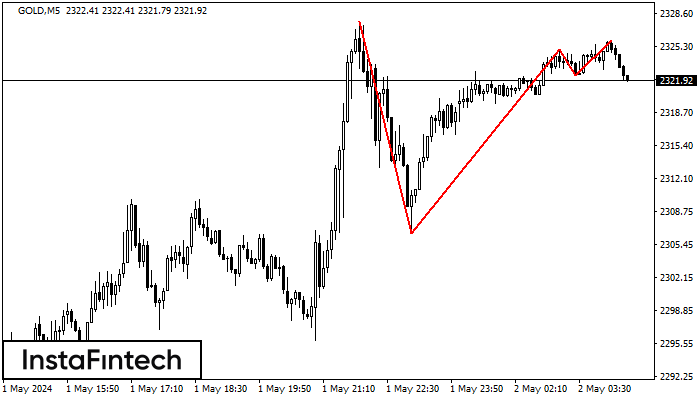
Triple Top
The Triple Top pattern has formed on the chart of the GOLD M5. Features of the pattern: borders have an ascending angle; the lower line of the pattern has the coordinates 2306.57/2322.47 with the upper limit 2327.81/2325.93; the projection of the width is 2124 points. The formation of the Triple Top figure most likely indicates a change in the trend from upward to downward. This means that in the event of a breakdown of the support level of 2306.57, the price is most likely to continue the downward movement.
GOLD M15
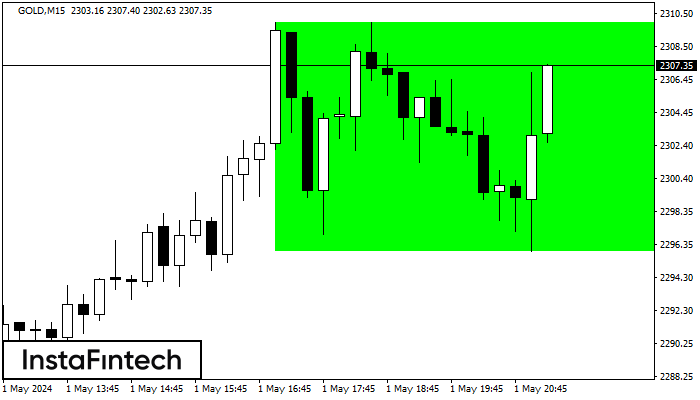
Bullish Rectangle
According to the chart of M15, GOLD formed the Bullish Rectangle. This type of a pattern indicates a trend continuation. It consists of two levels: resistance 2309.99 and support 2295.89. In case the resistance level 2309.99 - 2309.99 is broken, the instrument is likely to follow the bullish trend.
GOLD M15
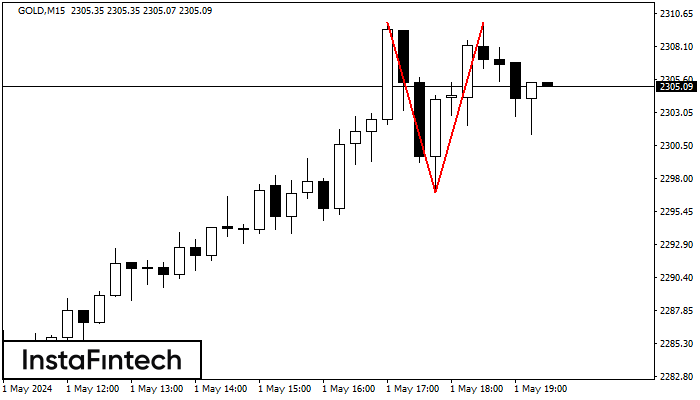
Double Top
The Double Top reversal pattern has been formed on GOLD M15. Characteristics: the upper boundary 2309.99; the lower boundary 2296.94; the width of the pattern is 1304 points. Sell trades are better to be opened below the lower boundary 2296.94 with a possible movements towards the 2296.72 level.
GOLD M30
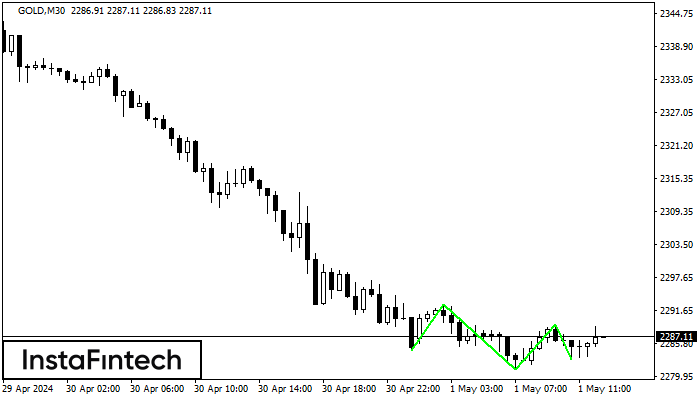
Triple Bottom
The Triple Bottom pattern has formed on the chart of the GOLD M30 trading instrument. The pattern signals a change in the trend from downwards to upwards in the case of breakdown of 2292.79/2289.27.
GOLD M5
Double Top
The Double Top pattern has been formed on GOLD M5. It signals that the trend has been changed from upwards to downwards. Probably, if the base of the pattern 2281.14 is broken, the downward movement will continue.
GOLD M5
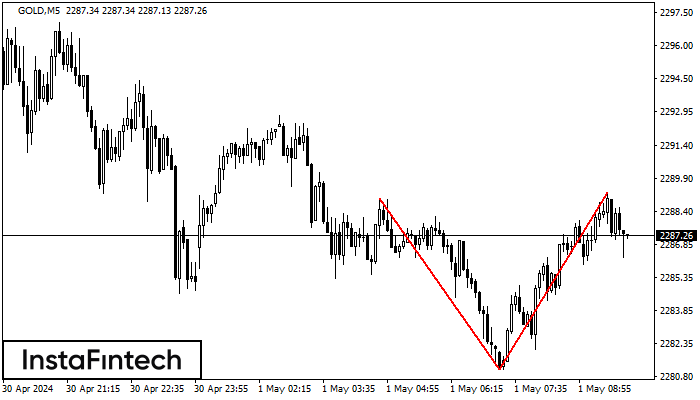
Inverse Head and Shoulder
According to M5, GOLD is shaping the technical pattern – the Inverse Head and Shoulder. In case the Neckline 2317.97/2316.88 is broken out, the instrument is likely to move toward 2317.03.
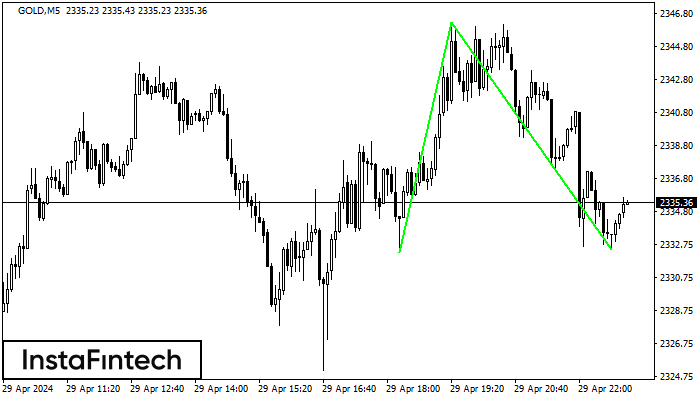
GOLD M5
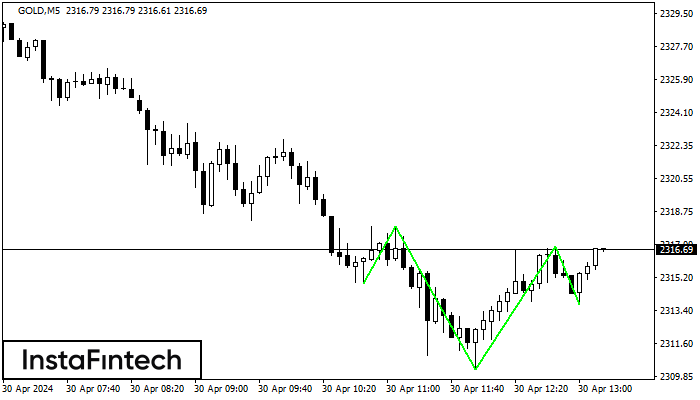
Double Bottom
The Double Bottom pattern has been formed on GOLD M5; the upper boundary is 2336.69; the lower boundary is 2332.40. The width of the pattern is 420 points. In case of a break of the upper boundary 2336.69, a change in the trend can be predicted where the width of the pattern will coincide with the distance to a possible take profit level.
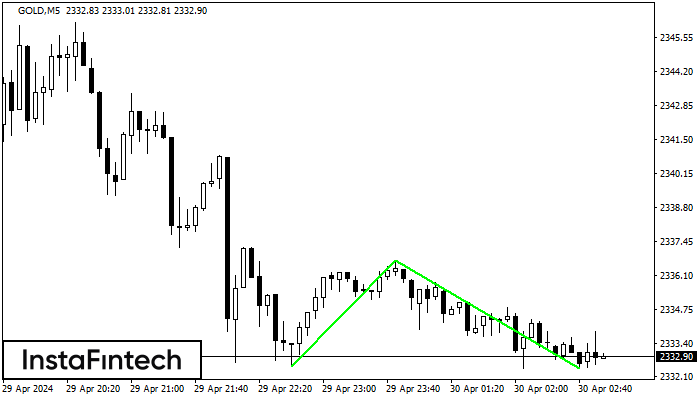
GOLD M5
Double Bottom
The Double Bottom pattern has been formed on GOLD M5. Characteristics: the support level 2332.29; the resistance level 2346.25; the width of the pattern 1396 points. If the resistance level is broken, a change in the trend can be predicted with the first target point lying at the distance of 1376 points.