 English
  Русский
 Bahasa Indonesia
 Bahasa Malay
 ไทย
ไทย Español
 Deutsch
 Български
 Français
 Tiếng Việt
 中文
中文 বাংলা
বাংলা हिन्दी
 Čeština
 Українська
 Română
FX.co ★ Patterns GBPAUD | British Pound (GBP) to Australian Dollar (AUD) Rate in the Forex market

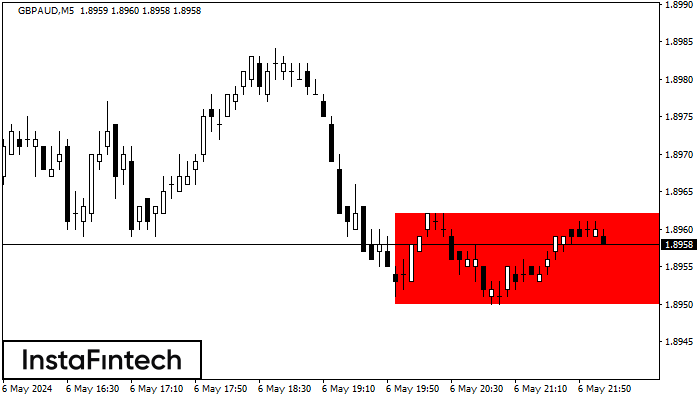
GBPAUD M5
Bearish Rectangle
According to the chart of M5, GBPAUD formed the Bearish Rectangle which is a pattern of a trend continuation. The pattern is contained within the following borders: lower border 1.8950 – 1.8950 and upper border 1.8962 – 1.8962. In case the lower border is broken, the instrument is likely to follow the downward trend.
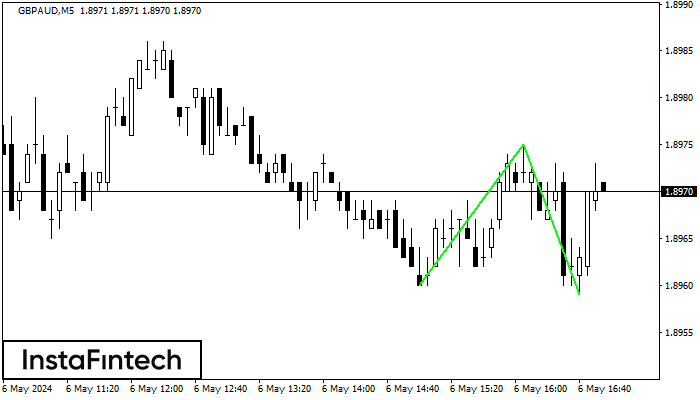
GBPAUD M5
Double Bottom
The Double Bottom pattern has been formed on GBPAUD M5; the upper boundary is 1.8975; the lower boundary is 1.8959. The width of the pattern is 15 points. In case of a break of the upper boundary 1.8975, a change in the trend can be predicted where the width of the pattern will coincide with the distance to a possible take profit level.
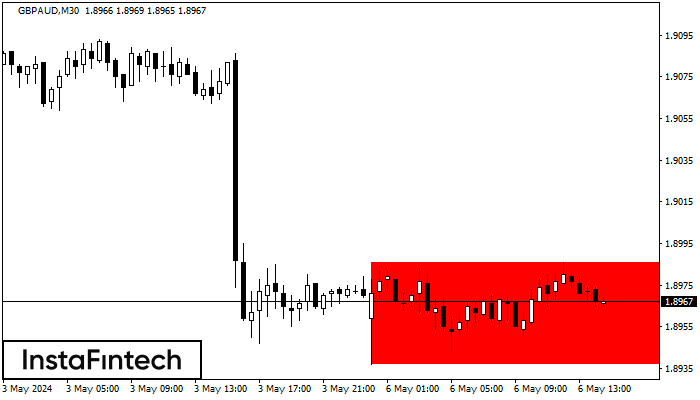
GBPAUD M30
Bearish Rectangle
According to the chart of M30, GBPAUD formed the Bearish Rectangle. This type of a pattern indicates a trend continuation. It consists of two levels: resistance 1.8986 - 0.0000 and support 1.8937 – 1.8937. In case the resistance level 1.8937 - 1.8937 is broken, the instrument is likely to follow the bearish trend.
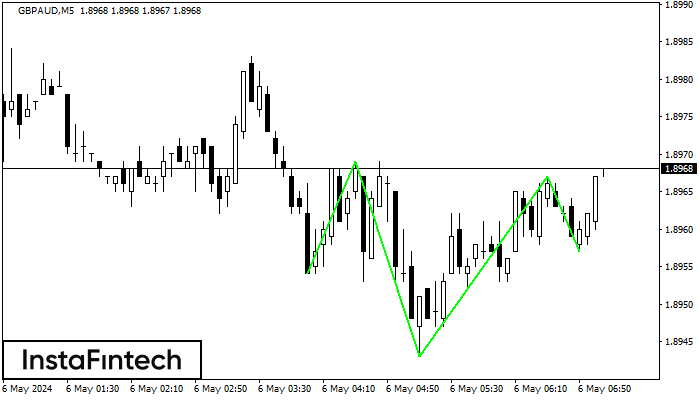
GBPAUD M5
Inverse Head and Shoulder
According to the chart of M5, GBPAUD formed the Inverse Head and Shoulder pattern. The Head’s top is set at 1.8967 while the median line of the Neck is found at 1.8943/1.8957. The formation of the Inverse Head and Shoulder pattern evidently signals a reversal of the downward trend. In other words, in case the scenario comes true, the price of GBPAUD will go towards 1.8982
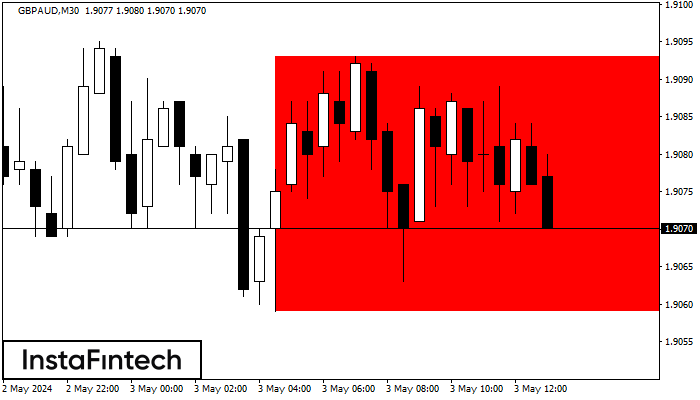
GBPAUD M30
Bearish Rectangle
According to the chart of M30, GBPAUD formed the Bearish Rectangle. The pattern indicates a trend continuation. The upper border is 1.9093, the lower border is 1.9059. The signal means that a short position should be opened after fixing a price below the lower border 1.9059 of the Bearish Rectangle.
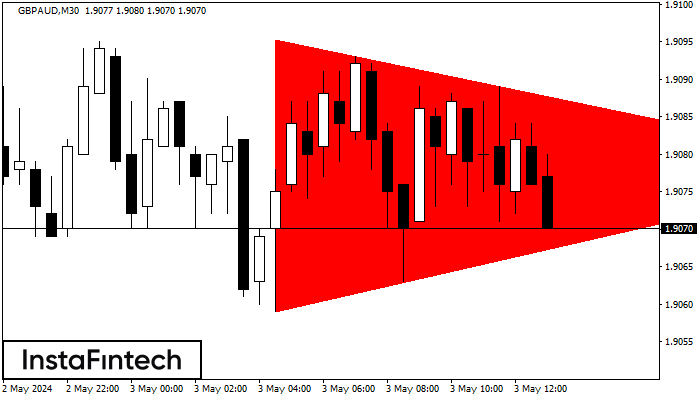
GBPAUD M30
Bearish Symmetrical Triangle
According to the chart of M30, GBPAUD formed the Bearish Symmetrical Triangle pattern. This pattern signals a further downward trend in case the lower border 1.9059 is breached. Here, a hypothetical profit will equal the width of the available pattern that is -36 pips.
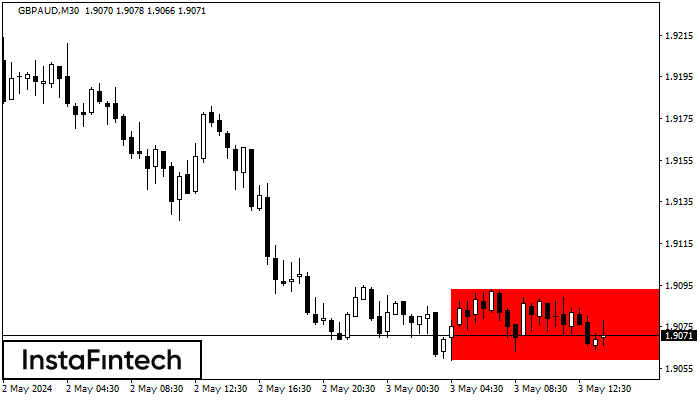
GBPAUD M30
Bearish Rectangle
According to the chart of M30, GBPAUD formed the Bearish Rectangle. The pattern indicates a trend continuation. The upper border is 1.9093, the lower border is 1.9059. The signal means that a short position should be opened after fixing a price below the lower border 1.9059 of the Bearish Rectangle.
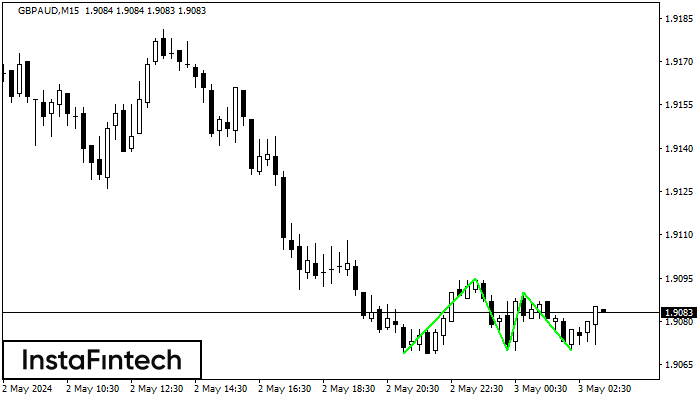
GBPAUD M15
Triple Bottom
The Triple Bottom pattern has formed on the chart of the GBPAUD M15 trading instrument. The pattern signals a change in the trend from downwards to upwards in the case of breakdown of 1.9095/1.9090.
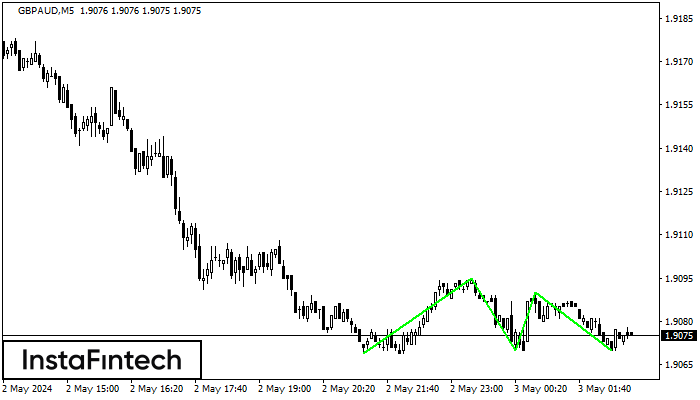
GBPAUD M5
Triple Bottom
The Triple Bottom pattern has formed on the chart of GBPAUD M5. Features of the pattern: The lower line of the pattern has coordinates 1.9095 with the upper limit 1.9095/1.9090, the projection of the width is 26 points. The formation of the Triple Bottom pattern most likely indicates a change in the trend from downward to upward. This means that in the event of a breakdown of the resistance level 1.9069, the price is most likely to continue the upward movement.
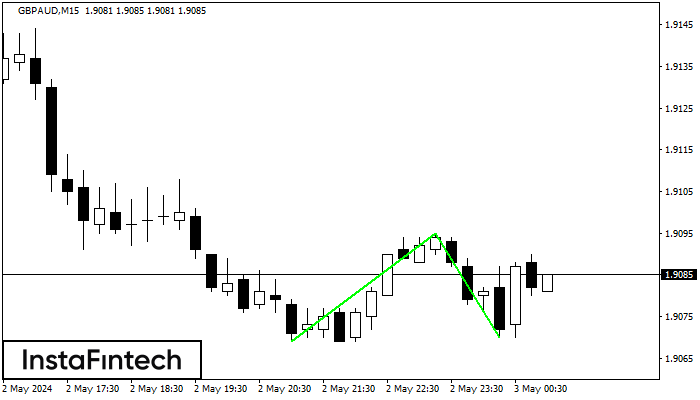
GBPAUD M15
Double Bottom
The Double Bottom pattern has been formed on GBPAUD M15. Characteristics: the support level 1.9069; the resistance level 1.9095; the width of the pattern 26 points. If the resistance level is broken, a change in the trend can be predicted with the first target point lying at the distance of 25 points.