 English
  Русский
 Bahasa Indonesia
 Bahasa Malay
 ไทย
ไทย Español
 Deutsch
 Български
 Français
 Tiếng Việt
 中文
中文 বাংলা
বাংলা हिन्दी
 Čeština
 Українська
 Română
FX.co ★ Patterns #FB | Facebook, Inc. Stock Price

#FB M5
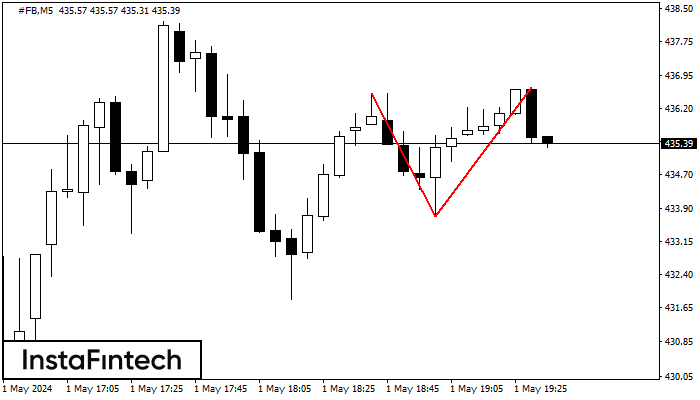
Double Top
The Double Top reversal pattern has been formed on #FB M5. Characteristics: the upper boundary 436.54; the lower boundary 433.73; the width of the pattern is 296 points. Sell trades are better to be opened below the lower boundary 433.73 with a possible movements towards the 433.58 level.
#FB H1
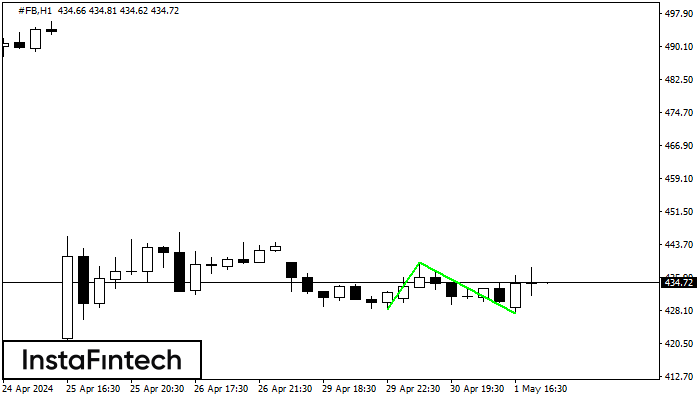
Double Bottom
The Double Bottom pattern has been formed on #FB H1. Characteristics: the support level 428.51; the resistance level 439.53; the width of the pattern 1102 points. If the resistance level is broken, a change in the trend can be predicted with the first target point lying at the distance of 1209 points.
#FB M5
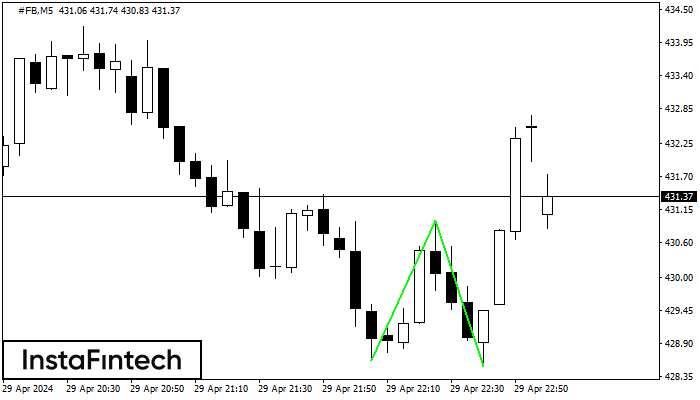
Double Bottom
The Double Bottom pattern has been formed on #FB M5; the upper boundary is 430.96; the lower boundary is 428.51. The width of the pattern is 235 points. In case of a break of the upper boundary 430.96, a change in the trend can be predicted where the width of the pattern will coincide with the distance to a possible take profit level.
#FB M30
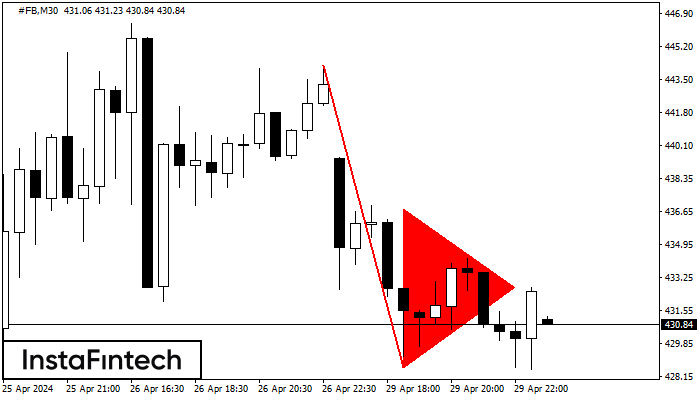
Bearish pennant
The Bearish pennant pattern has formed on the #FB M30 chart. The pattern signals continuation of the downtrend in case the pennant’s low of 428.60 is broken through. Recommendations: Place the sell stop pending order 10 pips below the pattern’s low. Place the take profit order at the projection distance of the flagpole height.
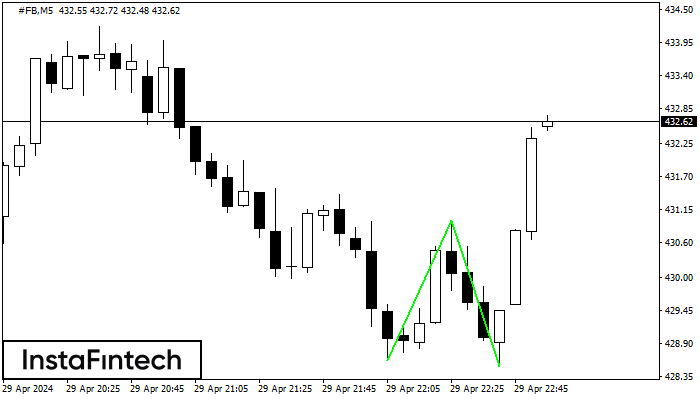
#FB M5
Double Bottom
The Double Bottom pattern has been formed on #FB M5. Characteristics: the support level 428.61; the resistance level 430.96; the width of the pattern 235 points. If the resistance level is broken, a change in the trend can be predicted with the first target point lying at the distance of 245 points.
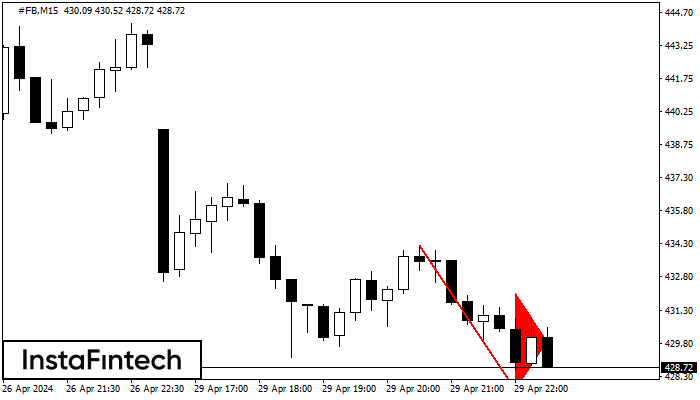
#FB M15
Bearish pennant
The Bearish pennant pattern has formed on the #FB M15 chart. The pattern signals continuation of the downtrend in case the pennant’s low of 427.69 is broken through. Recommendations: Place the sell stop pending order 10 pips below the pattern’s low. Place the take profit order at the projection distance of the flagpole height.
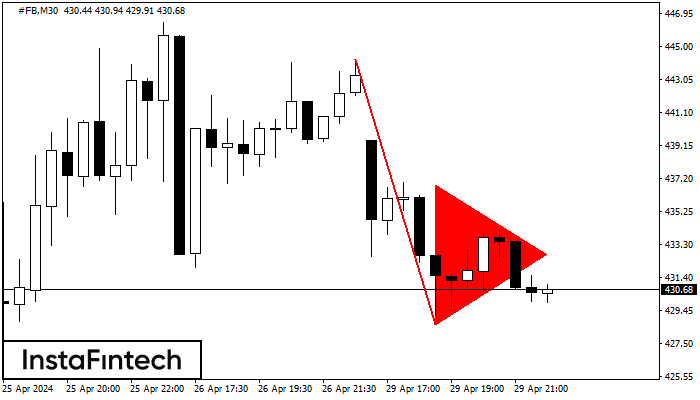
#FB M30
Bearish pennant
The Bearish pennant pattern has formed on the #FB M30 chart. This pattern type is characterized by a slight slowdown after which the price will move in the direction of the original trend. In case the price fixes below the pattern’s low of 428.60, a trader will be able to successfully enter the sell position.
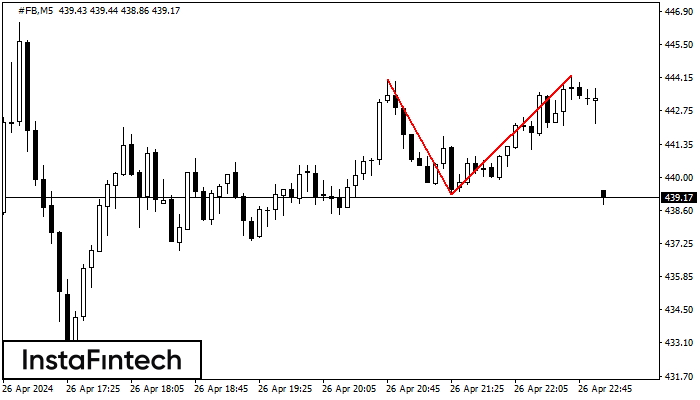
#FB M5
Double Top
The Double Top reversal pattern has been formed on #FB M5. Characteristics: the upper boundary 444.07; the lower boundary 439.28; the width of the pattern is 495 points. Sell trades are better to be opened below the lower boundary 439.28 with a possible movements towards the 439.13 level.
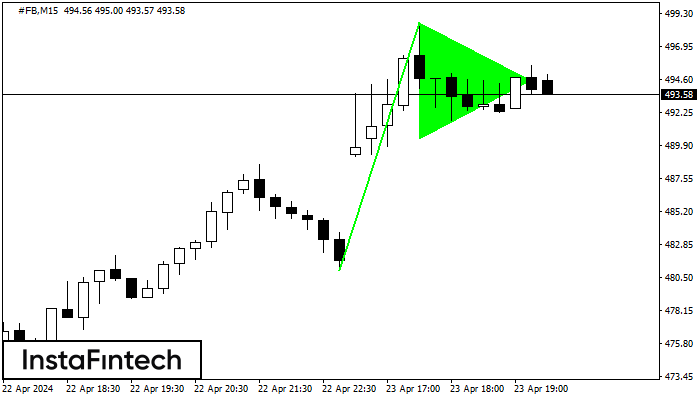
#FB M15
Bullish pennant
The Bullish pennant pattern is formed on the #FB M15 chart. It is a type of the continuation pattern. Supposedly, in case the price is fixed above the pennant’s high of 498.67, a further uptrend is possible.
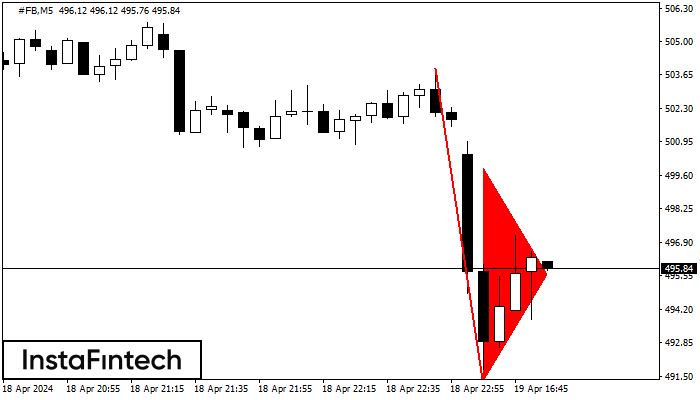
#FB M5
Bearish pennant
The Bearish pennant pattern has formed on the #FB M5 chart. This pattern type is characterized by a slight slowdown after which the price will move in the direction of the original trend. In case the price fixes below the pattern’s low of 491.31, a trader will be able to successfully enter the sell position.