 English
  Русский
 Bahasa Indonesia
 Bahasa Malay
 ไทย
ไทย Español
 Deutsch
 Български
 Français
 Tiếng Việt
 中文
中文 বাংলা
বাংলা हिन्दी
 Čeština
 Українська
 Română
FX.co ★ Patterns EURUSD | Euro (EUR) to US Dollar (USD) Rate in the Forex market

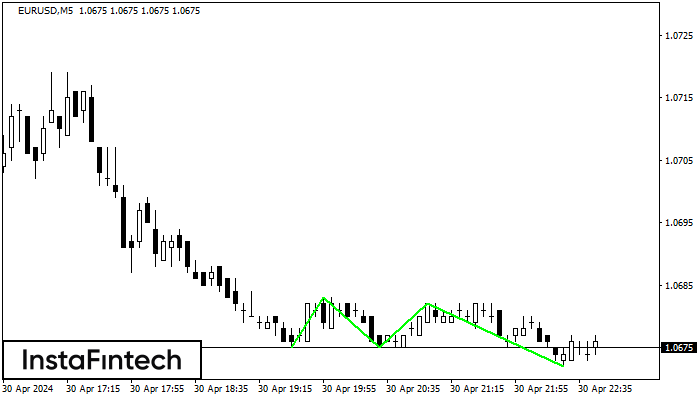
EURUSD M5
Triple Bottom
The Triple Bottom pattern has been formed on EURUSD M5. It has the following characteristics: resistance level 1.0683/1.0682; support level 1.0675/1.0672; the width is 8 points. In the event of a breakdown of the resistance level of 1.0683, the price is likely to continue an upward movement at least to 1.0690.
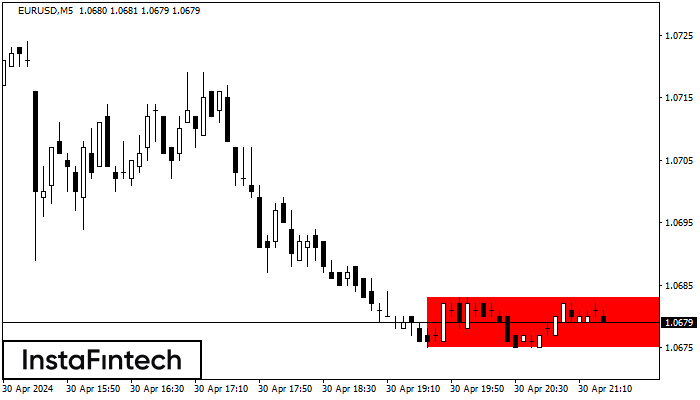
EURUSD M5
Bearish Rectangle
According to the chart of M5, EURUSD formed the Bearish Rectangle. This type of a pattern indicates a trend continuation. It consists of two levels: resistance 1.0683 - 0.0000 and support 1.0675 – 1.0675. In case the resistance level 1.0675 - 1.0675 is broken, the instrument is likely to follow the bearish trend.
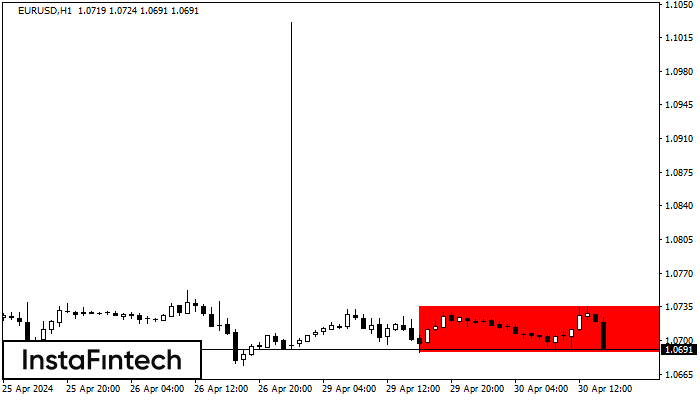
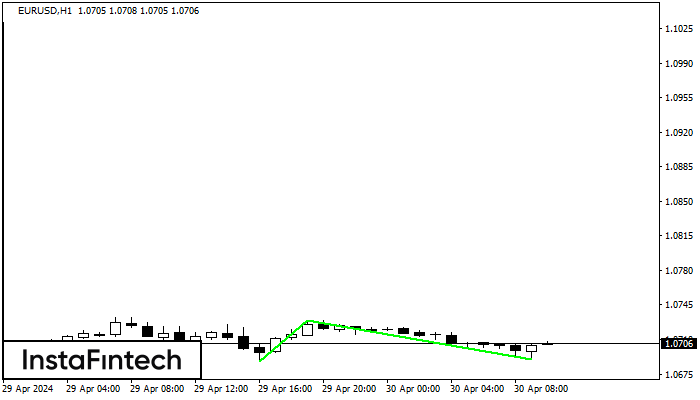
EURUSD H1
Bearish Rectangle
According to the chart of H1, EURUSD formed the Bearish Rectangle. The pattern indicates a trend continuation. The upper border is 1.0735, the lower border is 1.0688. The signal means that a short position should be opened after fixing a price below the lower border 1.0688 of the Bearish Rectangle.
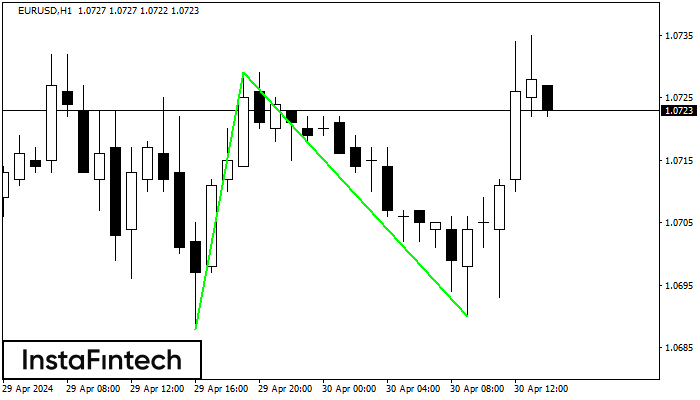
EURUSD H1
Double Bottom
The Double Bottom pattern has been formed on EURUSD H1. This formation signals a reversal of the trend from downwards to upwards. The signal is that a buy trade should be opened after the upper boundary of the pattern 1.0729 is broken. The further movements will rely on the width of the current pattern 41 points.
EURUSD H1
Double Bottom
The Double Bottom pattern has been formed on EURUSD H1. Characteristics: the support level 1.0688; the resistance level 1.0729; the width of the pattern 41 points. If the resistance level is broken, a change in the trend can be predicted with the first target point lying at the distance of 39 points.
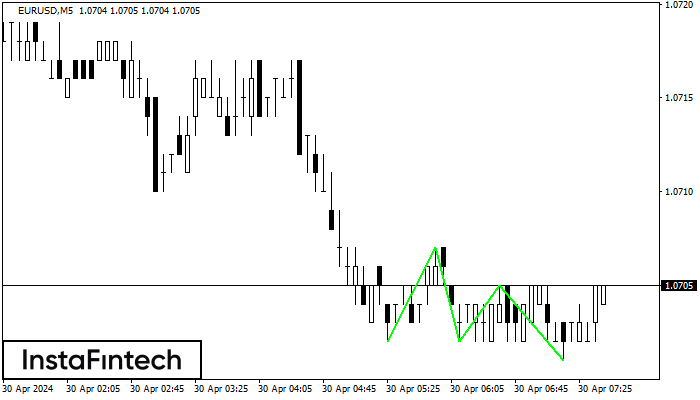
EURUSD M5
Triple Bottom
The Triple Bottom pattern has been formed on EURUSD M5. It has the following characteristics: resistance level 1.0707/1.0705; support level 1.0702/1.0701; the width is 5 points. In the event of a breakdown of the resistance level of 1.0707, the price is likely to continue an upward movement at least to 1.0717.
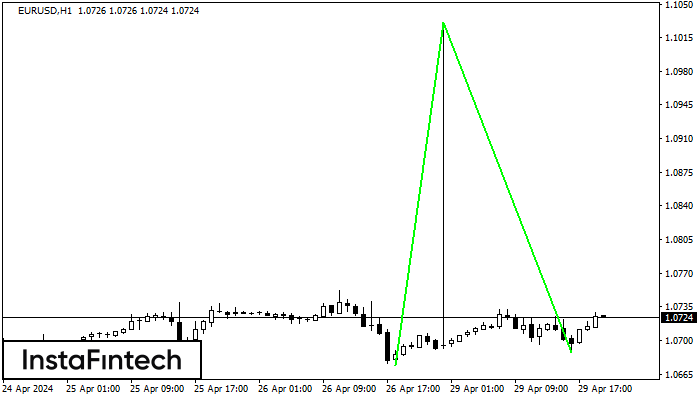
EURUSD H1
Double Bottom
The Double Bottom pattern has been formed on EURUSD H1; the upper boundary is 1.1031; the lower boundary is 1.0688. The width of the pattern is 357 points. In case of a break of the upper boundary 1.1031, a change in the trend can be predicted where the width of the pattern will coincide with the distance to a possible take profit level.
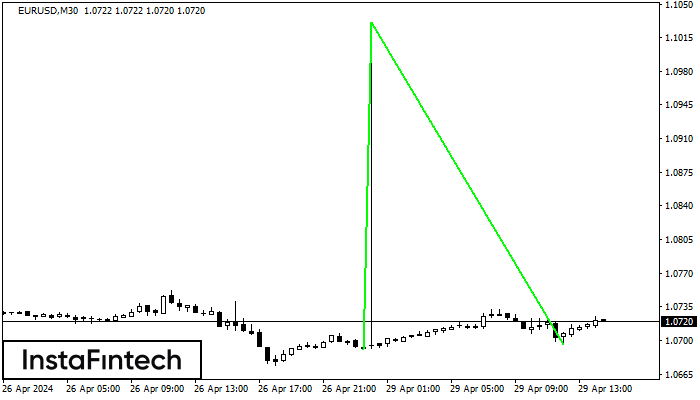
EURUSD M30
Double Bottom
The Double Bottom pattern has been formed on EURUSD M30. Characteristics: the support level 1.0691; the resistance level 1.1031; the width of the pattern 340 points. If the resistance level is broken, a change in the trend can be predicted with the first target point lying at the distance of 335 points.
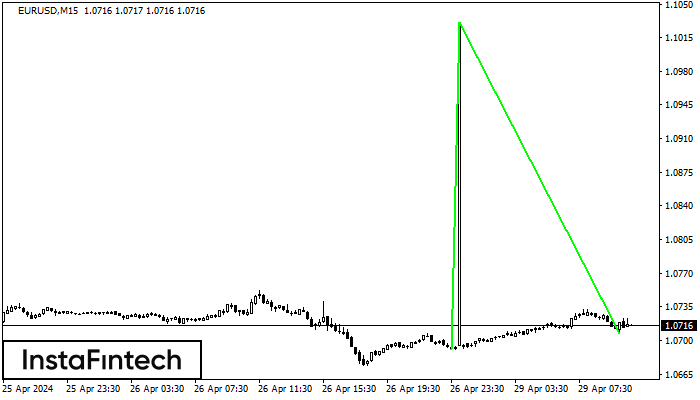
EURUSD M15
Double Bottom
The Double Bottom pattern has been formed on EURUSD M15; the upper boundary is 1.1031; the lower boundary is 1.0707. The width of the pattern is 340 points. In case of a break of the upper boundary 1.1031, a change in the trend can be predicted where the width of the pattern will coincide with the distance to a possible take profit level.
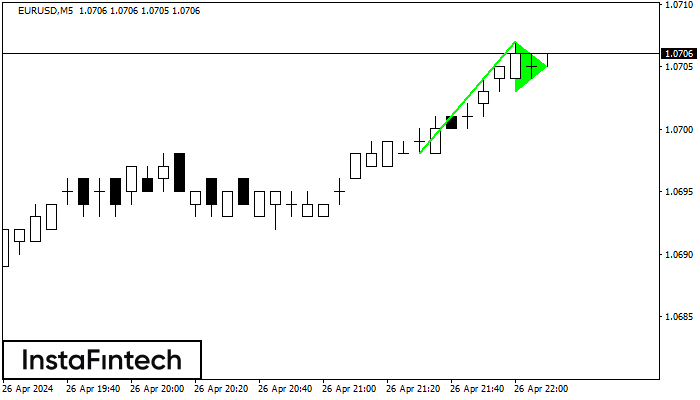
EURUSD M5
Bullish pennant
The Bullish pennant signal – Trading instrument EURUSD M5, continuation pattern. Forecast: it is possible to set up a buy position above the pattern’s high of 1.0707, with the prospect of the next move being a projection of the flagpole height.