 English
  Русский
 Bahasa Indonesia
 Bahasa Malay
 ไทย
ไทย Español
 Deutsch
 Български
 Français
 Tiếng Việt
 中文
中文 বাংলা
বাংলা हिन्दी
 Čeština
 Українська
 Română
FX.co ★ Patterns EURNZD | Euro (EUR) to New Zealand Dollar (NZD) Rate in the Forex market

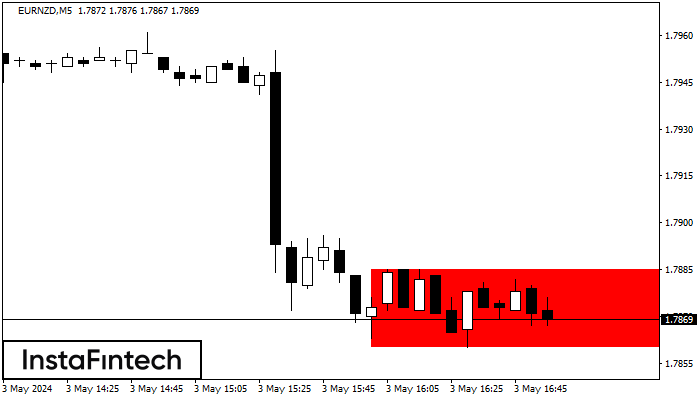
EURNZD M5
Bearish Rectangle
According to the chart of M5, EURNZD formed the Bearish Rectangle. This type of a pattern indicates a trend continuation. It consists of two levels: resistance 1.7885 - 0.0000 and support 1.7860 – 1.7860. In case the resistance level 1.7860 - 1.7860 is broken, the instrument is likely to follow the bearish trend.
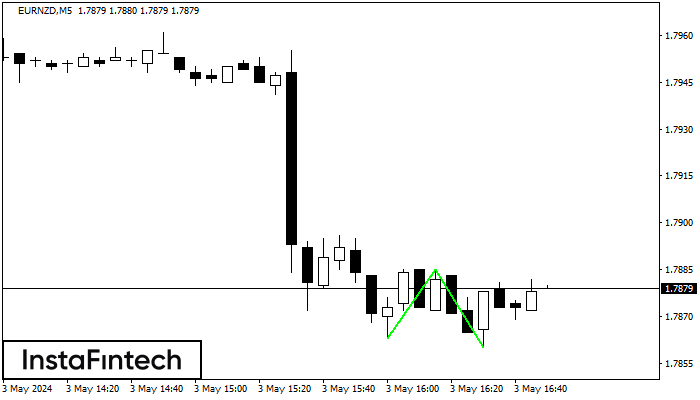
EURNZD M5
Double Bottom
The Double Bottom pattern has been formed on EURNZD M5. Characteristics: the support level 1.7863; the resistance level 1.7885; the width of the pattern 22 points. If the resistance level is broken, a change in the trend can be predicted with the first target point lying at the distance of 25 points.
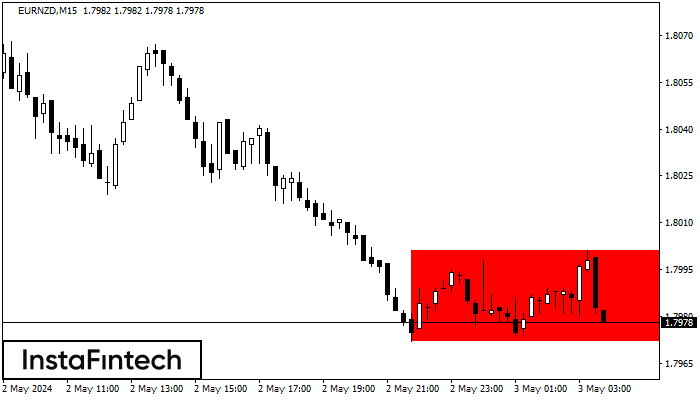
EURNZD M15
Bearish Rectangle
According to the chart of M15, EURNZD formed the Bearish Rectangle. This type of a pattern indicates a trend continuation. It consists of two levels: resistance 1.8001 - 0.0000 and support 1.7972 – 1.7972. In case the resistance level 1.7972 - 1.7972 is broken, the instrument is likely to follow the bearish trend.
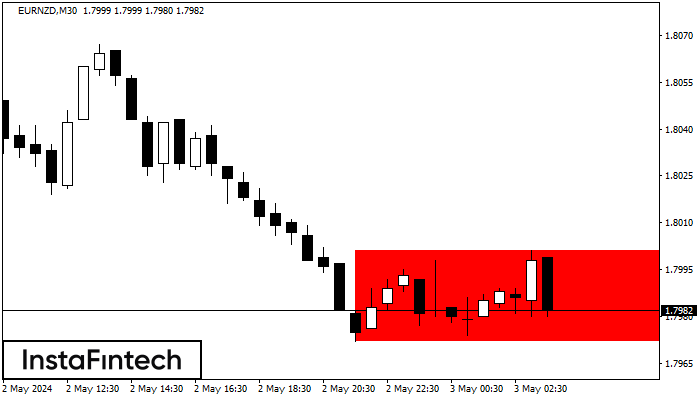
EURNZD M30
Bearish Rectangle
According to the chart of M30, EURNZD formed the Bearish Rectangle. The pattern indicates a trend continuation. The upper border is 1.8001, the lower border is 1.7972. The signal means that a short position should be opened after fixing a price below the lower border 1.7972 of the Bearish Rectangle.
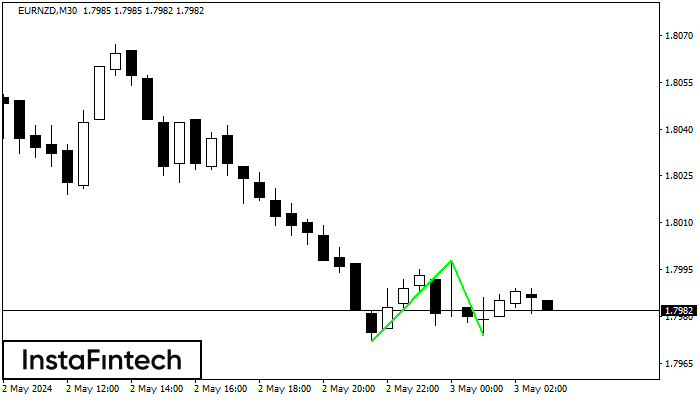
EURNZD M30
Double Bottom
The Double Bottom pattern has been formed on EURNZD M30; the upper boundary is 1.7998; the lower boundary is 1.7974. The width of the pattern is 26 points. In case of a break of the upper boundary 1.7998, a change in the trend can be predicted where the width of the pattern will coincide with the distance to a possible take profit level.
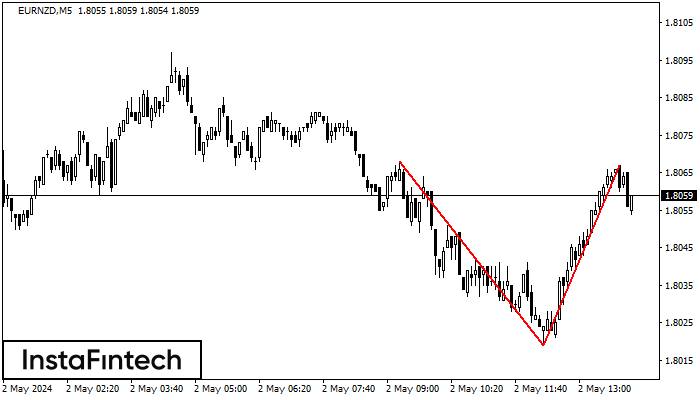
EURNZD M5
Double Top
The Double Top pattern has been formed on EURNZD M5. It signals that the trend has been changed from upwards to downwards. Probably, if the base of the pattern 1.8019 is broken, the downward movement will continue.
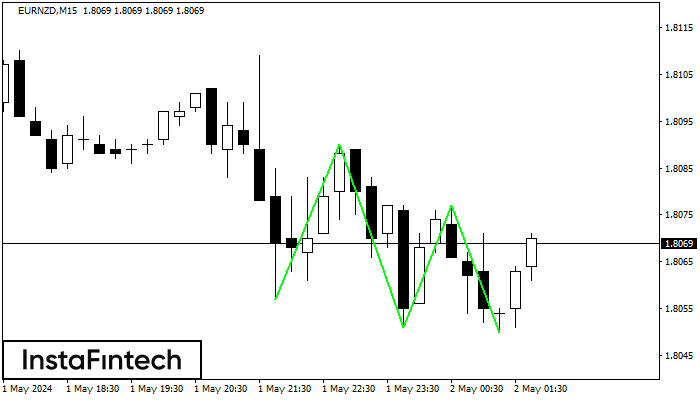
EURNZD M15
Triple Bottom
The Triple Bottom pattern has formed on the chart of the EURNZD M15 trading instrument. The pattern signals a change in the trend from downwards to upwards in the case of breakdown of 1.8090/1.8077.
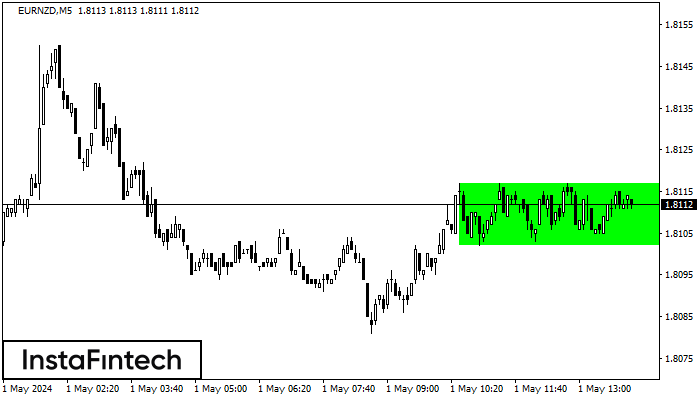
EURNZD M5
Bullish Rectangle
According to the chart of M5, EURNZD formed the Bullish Rectangle. The pattern indicates a trend continuation. The upper border is 1.8117, the lower border is 1.8102. The signal means that a long position should be opened above the upper border 1.8117 of the Bullish Rectangle.
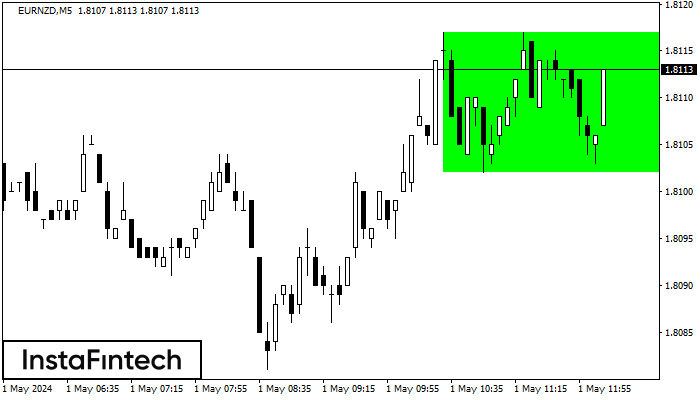
EURNZD M5
Bullish Rectangle
According to the chart of M5, EURNZD formed the Bullish Rectangle which is a pattern of a trend continuation. The pattern is contained within the following borders: the lower border 1.8102 – 1.8102 and upper border 1.8117 – 1.8117. In case the upper border is broken, the instrument is likely to follow the upward trend.
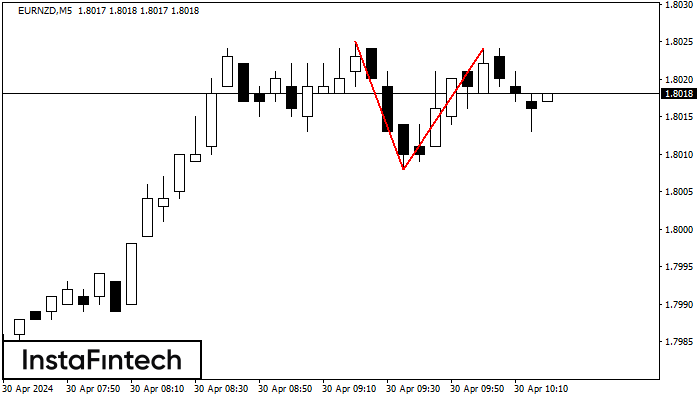
EURNZD M5
Double Top
On the chart of EURNZD M5 the Double Top reversal pattern has been formed. Characteristics: the upper boundary 1.8024; the lower boundary 1.8008; the width of the pattern 16 points. The signal: a break of the lower boundary will cause continuation of the downward trend targeting the 1.7993 level.