 English
  Русский
 Bahasa Indonesia
 Bahasa Malay
 ไทย
ไทย Español
 Deutsch
 Български
 Français
 Tiếng Việt
 中文
中文 বাংলা
বাংলা हिन्दी
 Čeština
 Українська
 Română
FX.co ★ Patterns EURJPY | Euro (EUR) to Japanese Yen (JPY) Rate in the Forex market

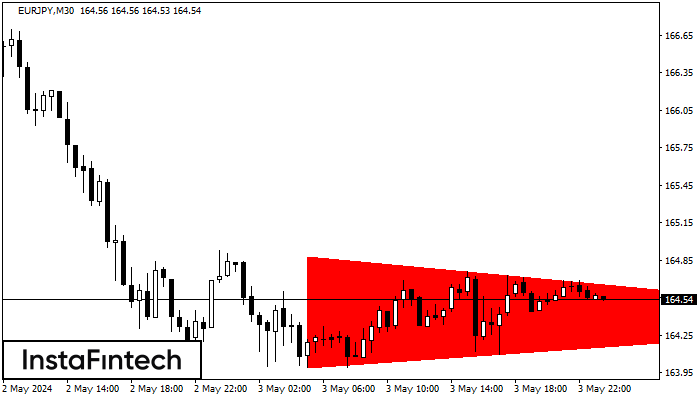
EURJPY M30
Bearish Symmetrical Triangle
According to the chart of M30, EURJPY formed the Bearish Symmetrical Triangle pattern. This pattern signals a further downward trend in case the lower border 163.99 is breached. Here, a hypothetical profit will equal the width of the available pattern that is -89 pips.
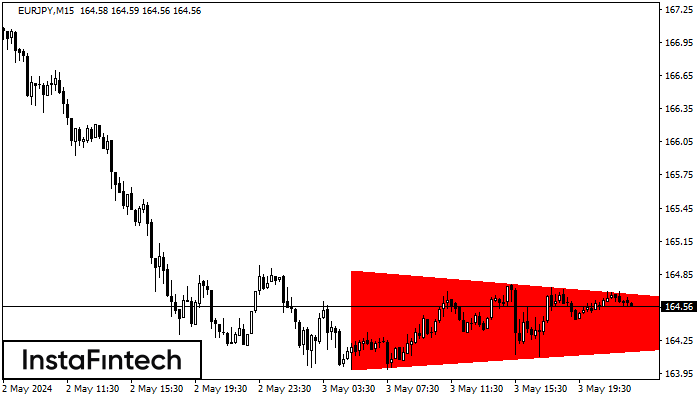
EURJPY M15
Bearish Symmetrical Triangle
According to the chart of M15, EURJPY formed the Bearish Symmetrical Triangle pattern. Trading recommendations: A breach of the lower border 163.99 is likely to encourage a continuation of the downward trend.
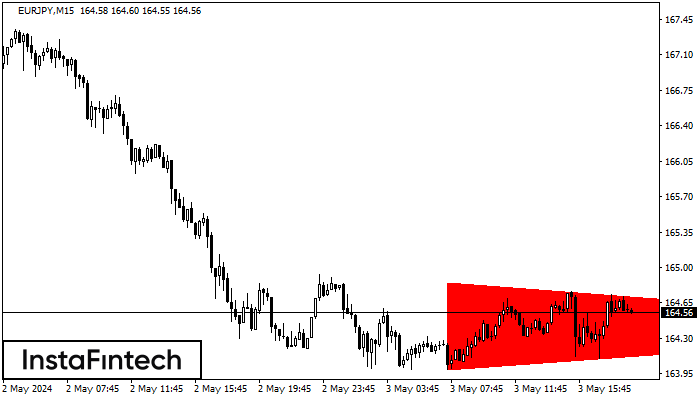
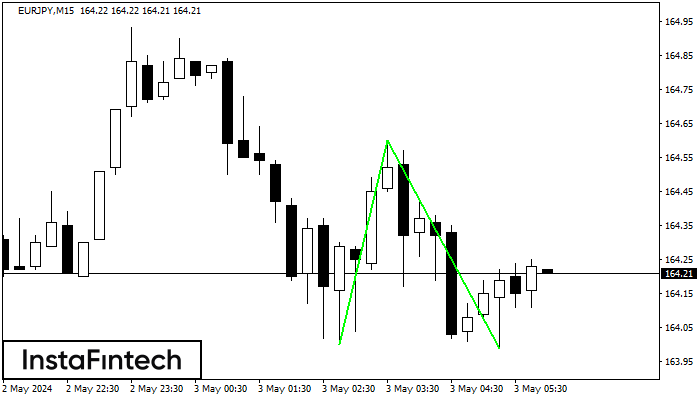
EURJPY M15
Bearish Symmetrical Triangle
According to the chart of M15, EURJPY formed the Bearish Symmetrical Triangle pattern. Description: The lower border is 163.99/164.41 and upper border is 164.85/164.41. The pattern width is measured on the chart at -86 pips. The formation of the Bearish Symmetrical Triangle pattern evidently signals a continuation of the downward trend. In other words, if the scenario comes true and EURJPY breaches the lower border, the price could continue its move toward 164.18.
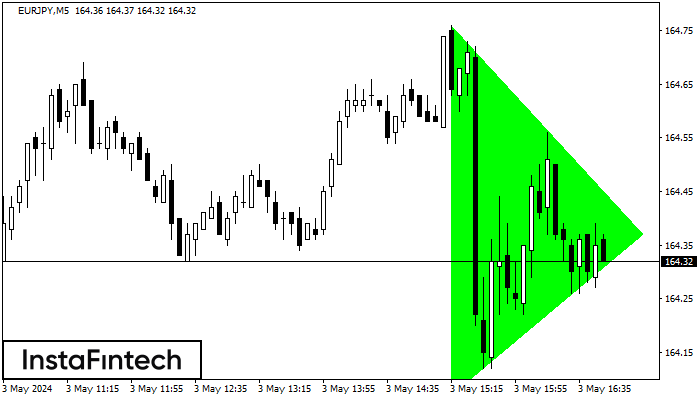
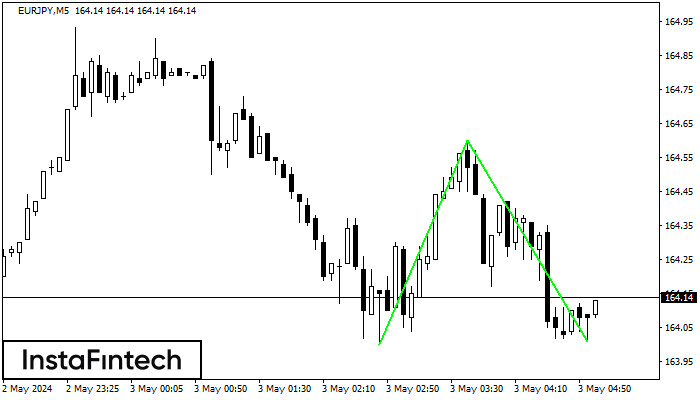
EURJPY M5
Bullish Symmetrical Triangle
According to the chart of M5, EURJPY formed the Bullish Symmetrical Triangle pattern. Description: This is the pattern of a trend continuation. 164.76 and 164.07 are the coordinates of the upper and lower borders respectively. The pattern width is measured on the chart at 69 pips. Outlook: If the upper border 164.76 is broken, the price is likely to continue its move by 164.52.
EURJPY M15
Double Bottom
The Double Bottom pattern has been formed on EURJPY M15; the upper boundary is 164.60; the lower boundary is 163.99. The width of the pattern is 60 points. In case of a break of the upper boundary 164.60, a change in the trend can be predicted where the width of the pattern will coincide with the distance to a possible take profit level.
EURJPY M5
Double Bottom
The Double Bottom pattern has been formed on EURJPY M5; the upper boundary is 164.60; the lower boundary is 164.01. The width of the pattern is 60 points. In case of a break of the upper boundary 164.60, a change in the trend can be predicted where the width of the pattern will coincide with the distance to a possible take profit level.
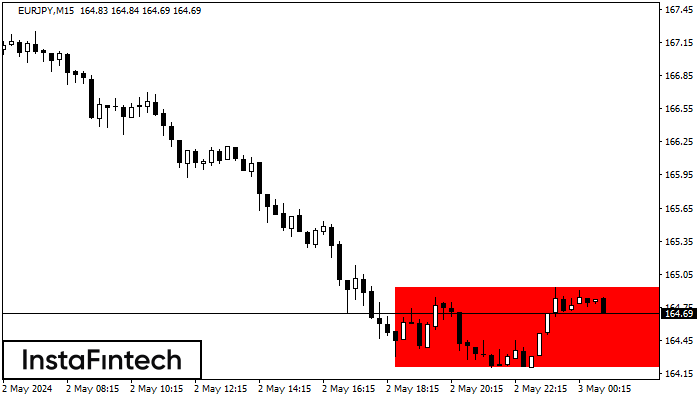
EURJPY M15
Bearish Rectangle
According to the chart of M15, EURJPY formed the Bearish Rectangle. The pattern indicates a trend continuation. The upper border is 164.93, the lower border is 164.20. The signal means that a short position should be opened after fixing a price below the lower border 164.20 of the Bearish Rectangle.
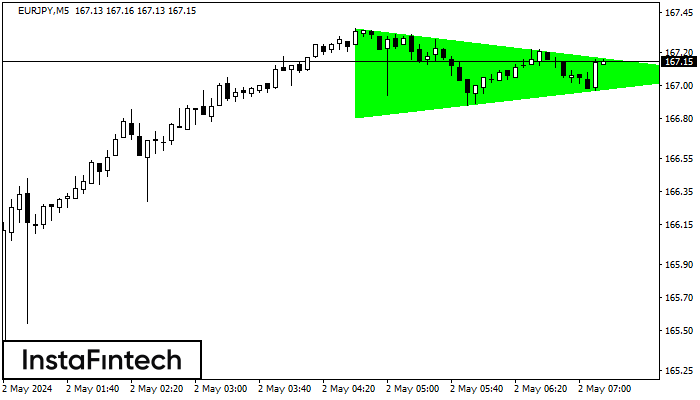
EURJPY M5
Bullish Symmetrical Triangle
According to the chart of M5, EURJPY formed the Bullish Symmetrical Triangle pattern. Description: This is the pattern of a trend continuation. 167.35 and 166.80 are the coordinates of the upper and lower borders respectively. The pattern width is measured on the chart at 55 pips. Outlook: If the upper border 167.35 is broken, the price is likely to continue its move by 167.22.
EURJPY M5
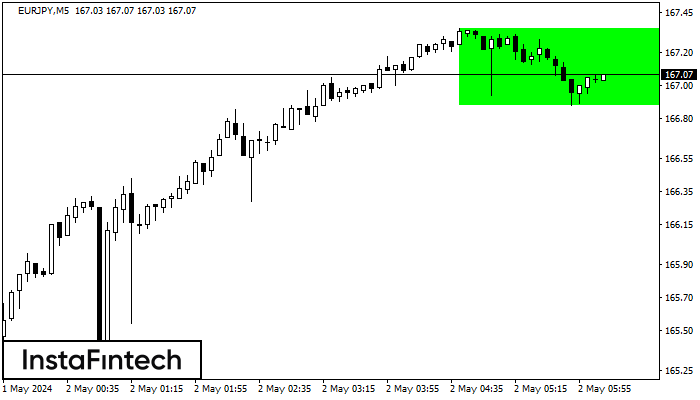
Bullish Rectangle
According to the chart of M5, EURJPY formed the Bullish Rectangle which is a pattern of a trend continuation. The pattern is contained within the following borders: the lower border 166.88 – 166.88 and upper border 167.35 – 167.35. In case the upper border is broken, the instrument is likely to follow the upward trend.
EURJPY M5
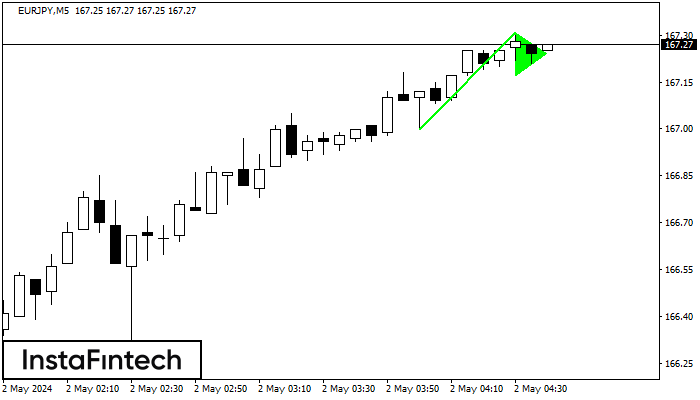
Bullish pennant
The Bullish pennant signal – Trading instrument EURJPY M5, continuation pattern. Forecast: it is possible to set up a buy position above the pattern’s high of 167.31, with the prospect of the next move being a projection of the flagpole height.