 English
  Русский
 Bahasa Indonesia
 Bahasa Malay
 ไทย
ไทย Español
 Deutsch
 Български
 Français
 Tiếng Việt
 中文
中文 বাংলা
বাংলা हिन्दी
 Čeština
 Українська
 Română
FX.co ★ Patterns EURCHF | Euro (EUR) to Swiss Franc (CHF) Rate in the Forex market

EURCHF M5
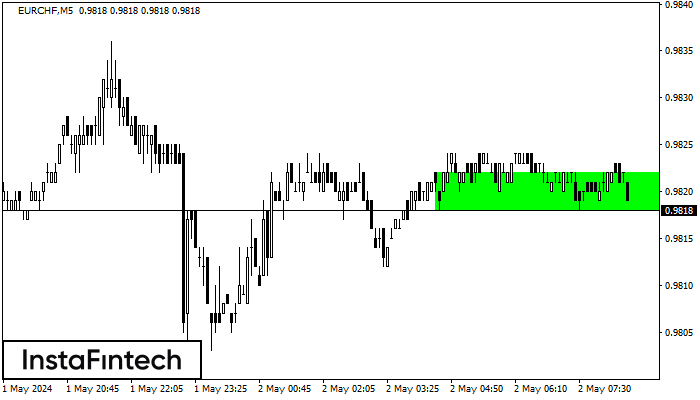
Bullish Rectangle
According to the chart of M5, EURCHF formed the Bullish Rectangle. This type of a pattern indicates a trend continuation. It consists of two levels: resistance 0.9822 and support 0.9818. In case the resistance level 0.9822 - 0.9822 is broken, the instrument is likely to follow the bullish trend.
EURCHF M5
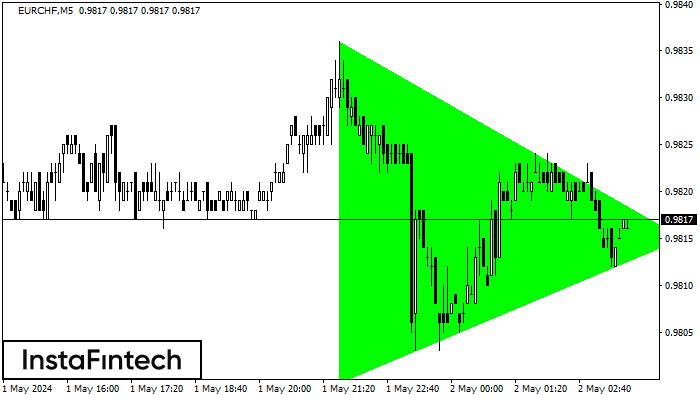
Bullish Symmetrical Triangle
According to the chart of M5, EURCHF formed the Bullish Symmetrical Triangle pattern. The lower border of the pattern touches the coordinates 0.9800/0.9815 whereas the upper border goes across 0.9836/0.9815. If the Bullish Symmetrical Triangle pattern is in progress, this evidently signals a further upward trend. In other words, in case the scenario comes true, the price of EURCHF will breach the upper border to head for 0.9830.
EURCHF M5
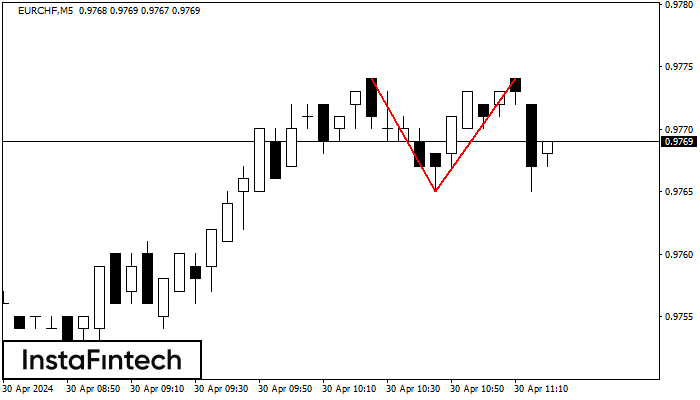
Double Top
On the chart of EURCHF M5 the Double Top reversal pattern has been formed. Characteristics: the upper boundary 0.9774; the lower boundary 0.9765; the width of the pattern 9 points. The signal: a break of the lower boundary will cause continuation of the downward trend targeting the 0.9750 level.
EURCHF H1
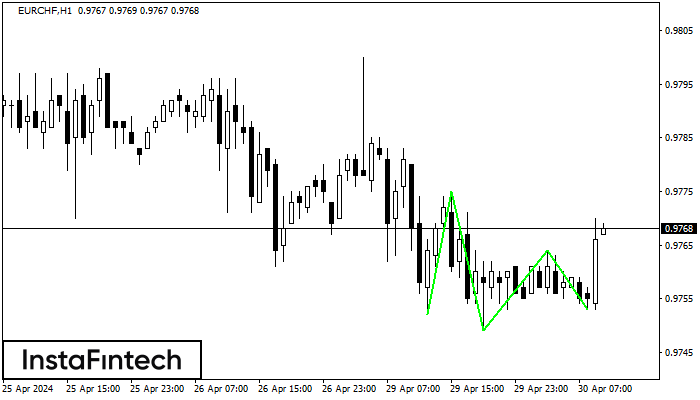
Triple Bottom
The Triple Bottom pattern has formed on the chart of EURCHF H1. Features of the pattern: The lower line of the pattern has coordinates 0.9775 with the upper limit 0.9775/0.9764, the projection of the width is 23 points. The formation of the Triple Bottom pattern most likely indicates a change in the trend from downward to upward. This means that in the event of a breakdown of the resistance level 0.9752, the price is most likely to continue the upward movement.
EURCHF M5
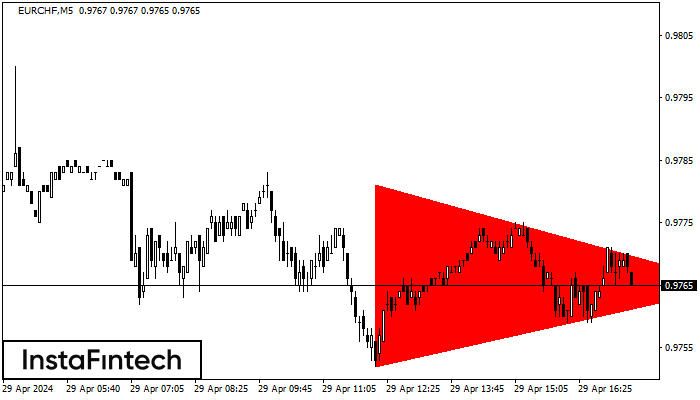
Bearish Symmetrical Triangle
According to the chart of M5, EURCHF formed the Bearish Symmetrical Triangle pattern. Trading recommendations: A breach of the lower border 0.9752 is likely to encourage a continuation of the downward trend.
EURCHF M5
Double Bottom
The Double Bottom pattern has been formed on EURCHF M5. Characteristics: the support level 0.9762; the resistance level 0.9775; the width of the pattern 13 points. If the resistance level is broken, a change in the trend can be predicted with the first target point lying at the distance of 12 points.
EURCHF H1
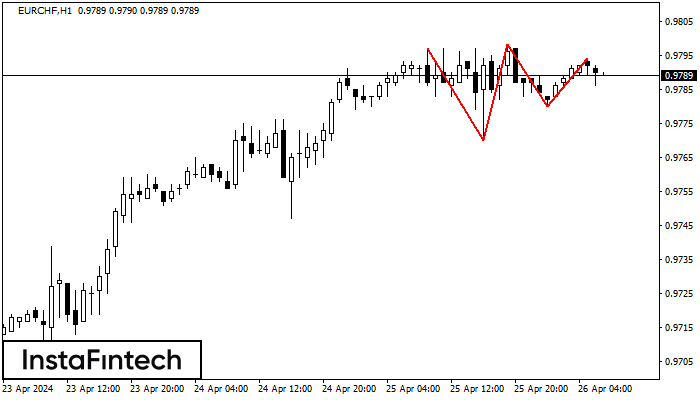
Triple Top
On the chart of the EURCHF H1 trading instrument, the Triple Top pattern that signals a trend change has formed. It is possible that after formation of the third peak, the price will try to break through the resistance level 0.9770, where we advise to open a trading position for sale. Take profit is the projection of the pattern’s width, which is 27 points.
EURCHF H1
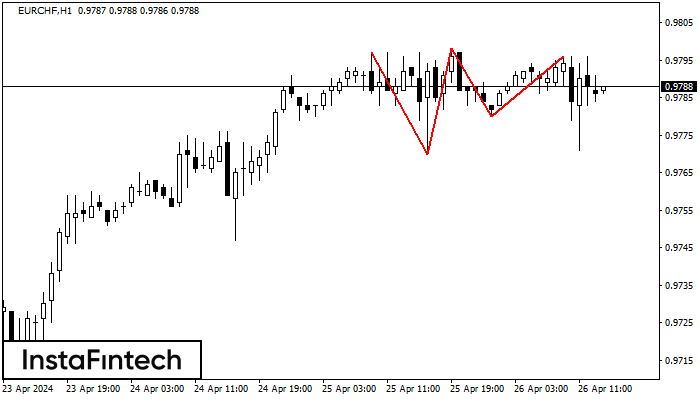
Triple Top
The Triple Top pattern has formed on the chart of the EURCHF H1 trading instrument. It is a reversal pattern featuring the following characteristics: resistance level 3, support level -10, and pattern’s width 27. Forecast If the price breaks through the support level 0.9770, it is likely to move further down to 0.9758.
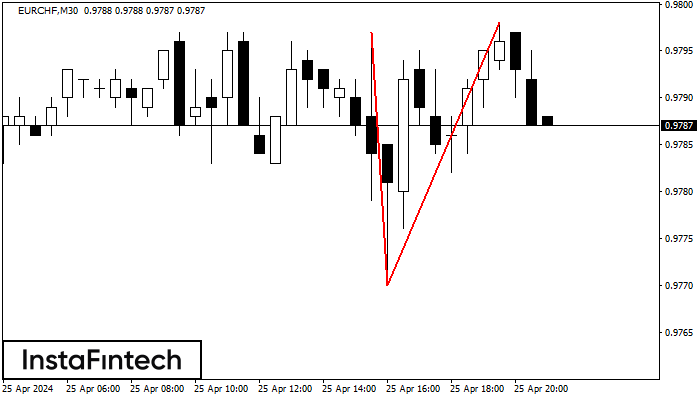
EURCHF M30
Double Top
On the chart of EURCHF M30 the Double Top reversal pattern has been formed. Characteristics: the upper boundary 0.9798; the lower boundary 0.9770; the width of the pattern 28 points. The signal: a break of the lower boundary will cause continuation of the downward trend targeting the 0.9740 level.
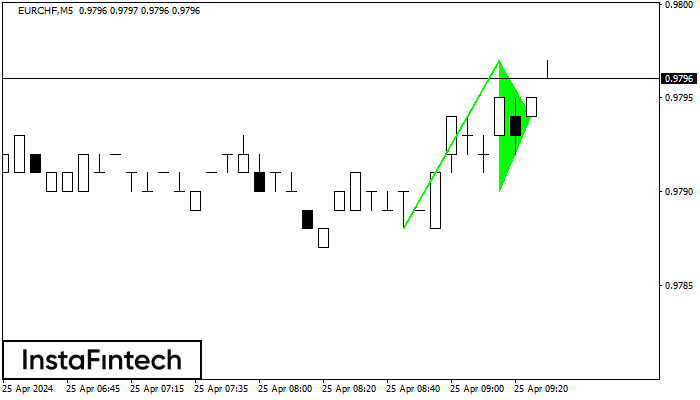
EURCHF M5
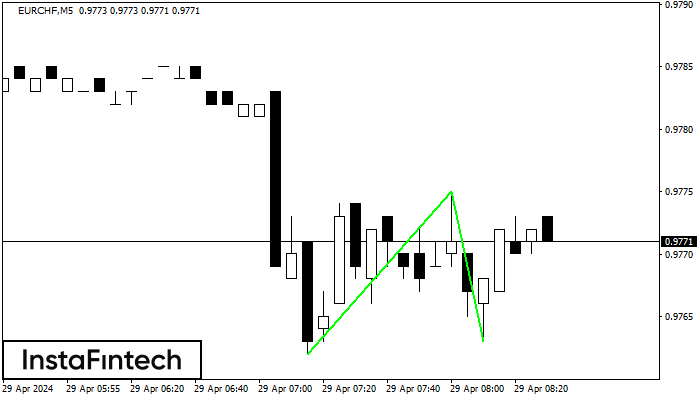
Bullish pennant
The Bullish pennant pattern is formed on the EURCHF M5 chart. It is a type of the continuation pattern. Supposedly, in case the price is fixed above the pennant’s high of 0.9797, a further uptrend is possible.