 English
  Русский
 Bahasa Indonesia
 Bahasa Malay
 ไทย
ไทย Español
 Deutsch
 Български
 Français
 Tiếng Việt
 中文
中文 বাংলা
বাংলা हिन्दी
 Čeština
 Українська
 Română
FX.co ★ Patterns EURCAD | Euro (EUR) to Canadian Dollar (CAD) Rate in the Forex market

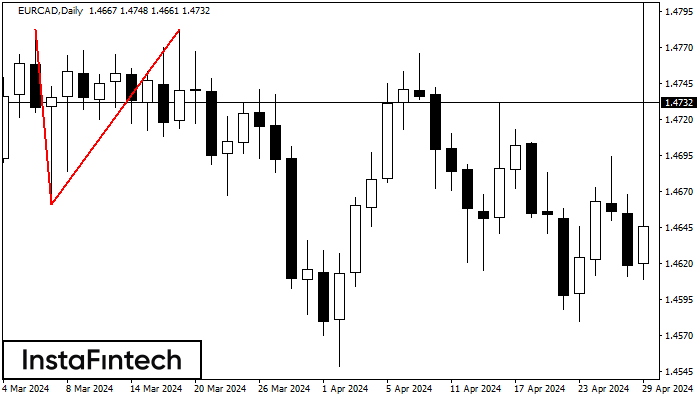
EURCAD D1
Double Top
The Double Top reversal pattern has been formed on EURCAD D1. Characteristics: the upper boundary 1.4782; the lower boundary 1.4661; the width of the pattern is 121 points. Sell trades are better to be opened below the lower boundary 1.4661 with a possible movements towards the 1.4621 level.
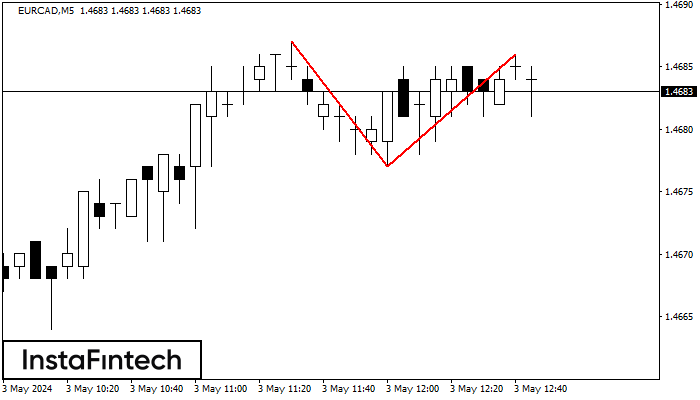
EURCAD M5
Double Top
The Double Top reversal pattern has been formed on EURCAD M5. Characteristics: the upper boundary 1.4687; the lower boundary 1.4677; the width of the pattern is 9 points. Sell trades are better to be opened below the lower boundary 1.4677 with a possible movements towards the 1.4662 level.
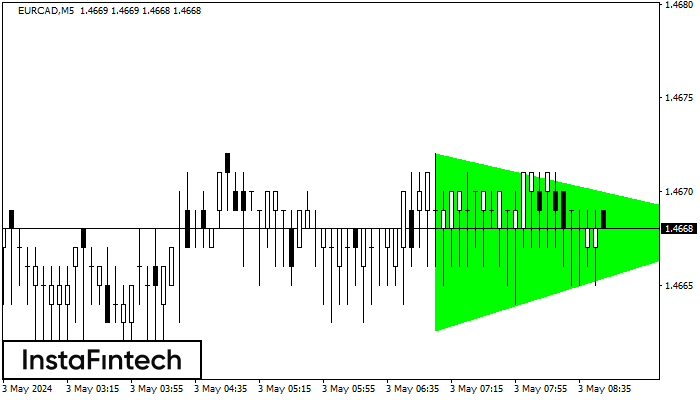
EURCAD M5
Bullish Symmetrical Triangle
According to the chart of M5, EURCAD formed the Bullish Symmetrical Triangle pattern. Description: This is the pattern of a trend continuation. 1.4672 and 1.4663 are the coordinates of the upper and lower borders respectively. The pattern width is measured on the chart at 9 pips. Outlook: If the upper border 1.4672 is broken, the price is likely to continue its move by 1.4683.
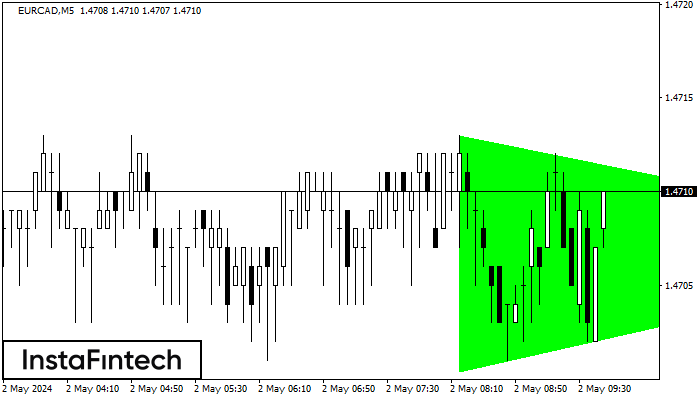
EURCAD M5
Bullish Symmetrical Triangle
According to the chart of M5, EURCAD formed the Bullish Symmetrical Triangle pattern. Description: This is the pattern of a trend continuation. 1.4713 and 1.4700 are the coordinates of the upper and lower borders respectively. The pattern width is measured on the chart at 13 pips. Outlook: If the upper border 1.4713 is broken, the price is likely to continue its move by 1.4722.
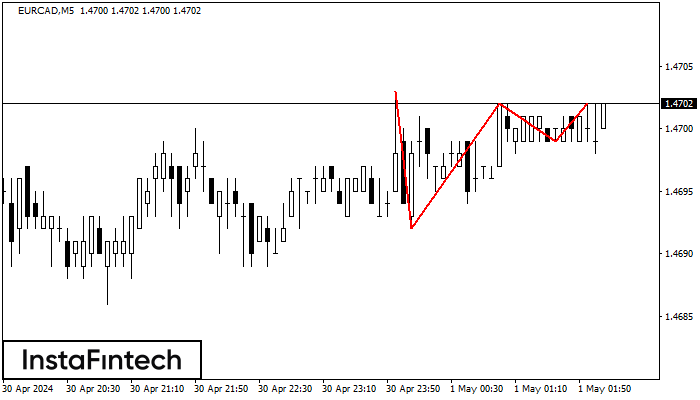
EURCAD M5
Triple Top
On the chart of the EURCAD M5 trading instrument, the Triple Top pattern that signals a trend change has formed. It is possible that after formation of the third peak, the price will try to break through the resistance level 1.4692, where we advise to open a trading position for sale. Take profit is the projection of the pattern’s width, which is 11 points.
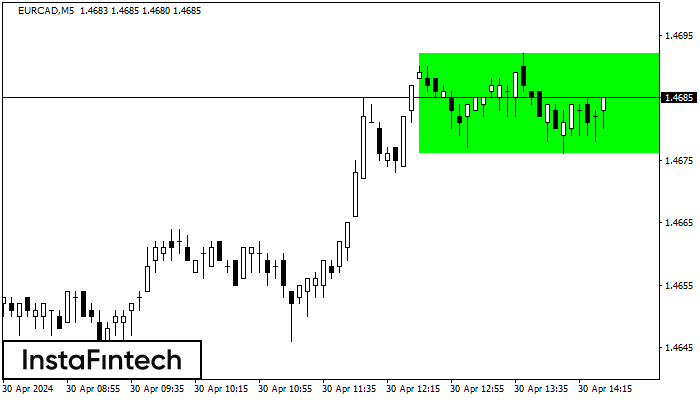
EURCAD M5
Bullish Rectangle
According to the chart of M5, EURCAD formed the Bullish Rectangle which is a pattern of a trend continuation. The pattern is contained within the following borders: the lower border 1.4676 – 1.4676 and upper border 1.4692 – 1.4692. In case the upper border is broken, the instrument is likely to follow the upward trend.
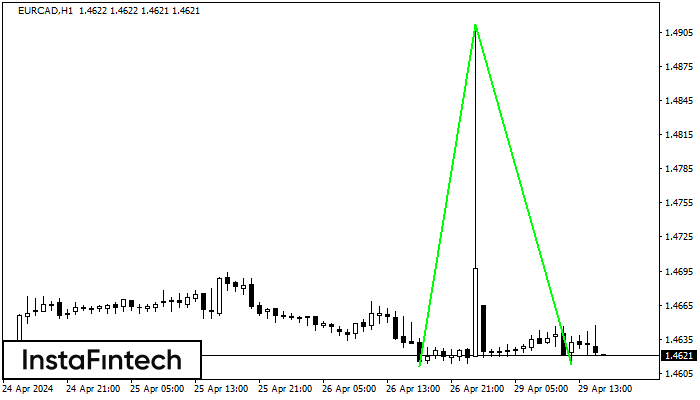
EURCAD H1
Double Bottom
The Double Bottom pattern has been formed on EURCAD H1. This formation signals a reversal of the trend from downwards to upwards. The signal is that a buy trade should be opened after the upper boundary of the pattern 1.4912 is broken. The further movements will rely on the width of the current pattern 301 points.
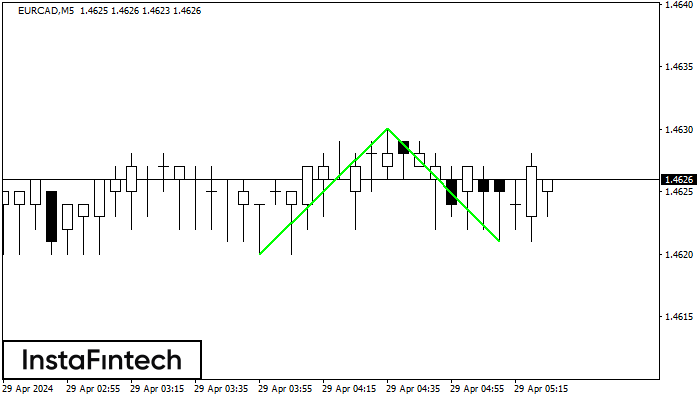
EURCAD M5
Double Bottom
The Double Bottom pattern has been formed on EURCAD M5; the upper boundary is 1.4630; the lower boundary is 1.4621. The width of the pattern is 10 points. In case of a break of the upper boundary 1.4630, a change in the trend can be predicted where the width of the pattern will coincide with the distance to a possible take profit level.
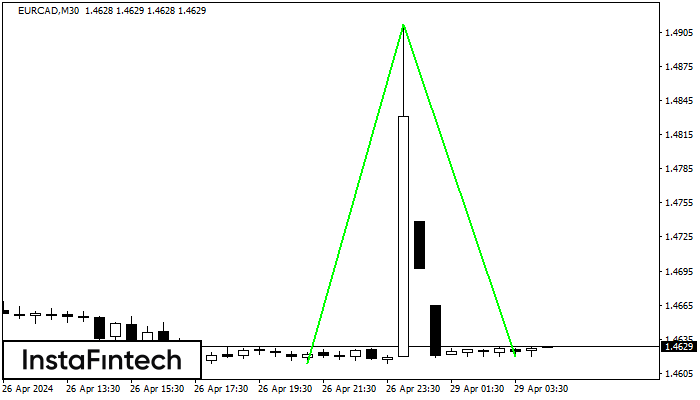
EURCAD M30
Double Bottom
The Double Bottom pattern has been formed on EURCAD M30. This formation signals a reversal of the trend from downwards to upwards. The signal is that a buy trade should be opened after the upper boundary of the pattern 1.4912 is broken. The further movements will rely on the width of the current pattern 298 points.
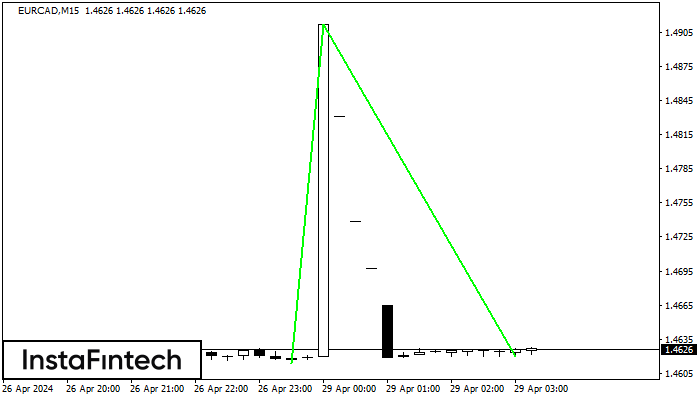
EURCAD M15
Double Bottom
The Double Bottom pattern has been formed on EURCAD M15. This formation signals a reversal of the trend from downwards to upwards. The signal is that a buy trade should be opened after the upper boundary of the pattern 1.4912 is broken. The further movements will rely on the width of the current pattern 298 points.