 English
  Русский
 Bahasa Indonesia
 Bahasa Malay
 ไทย
ไทย Español
 Deutsch
 Български
 Français
 Tiếng Việt
 中文
中文 বাংলা
বাংলা हिन्दी
 Čeština
 Українська
 Română
FX.co ★ Patterns #Bitcoin | Bitcoin cryptocurrency Rate in the Forex market

#Bitcoin M5
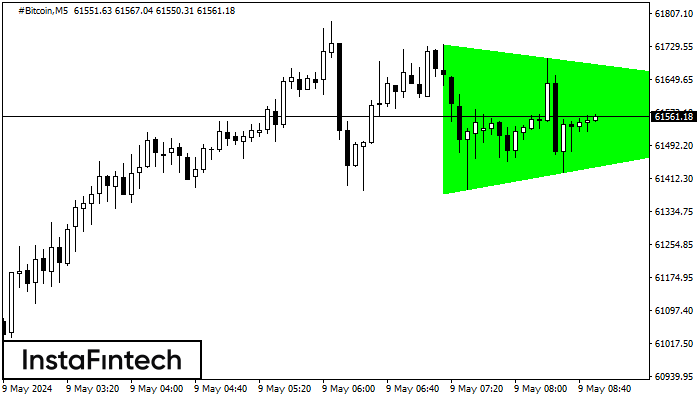
Bullish Symmetrical Triangle
According to the chart of M5, #Bitcoin formed the Bullish Symmetrical Triangle pattern. Description: This is the pattern of a trend continuation. 61734.07 and 61376.89 are the coordinates of the upper and lower borders respectively. The pattern width is measured on the chart at 35718 pips. Outlook: If the upper border 61734.07 is broken, the price is likely to continue its move by 61583.60.
#Bitcoin M5
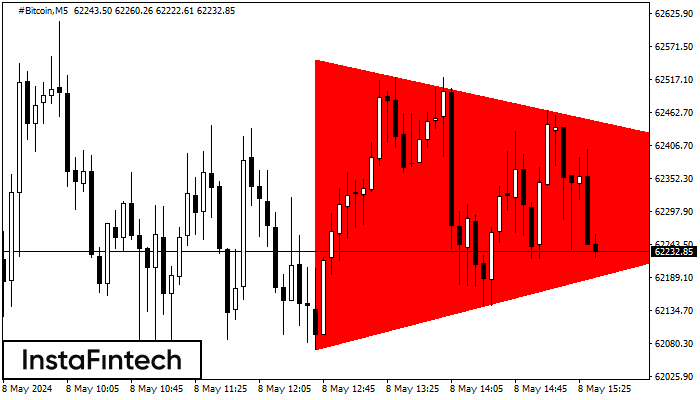
Bearish Symmetrical Triangle
According to the chart of M5, #Bitcoin formed the Bearish Symmetrical Triangle pattern. This pattern signals a further downward trend in case the lower border 62069.83 is breached. Here, a hypothetical profit will equal the width of the available pattern that is -47978 pips.
#Bitcoin M15
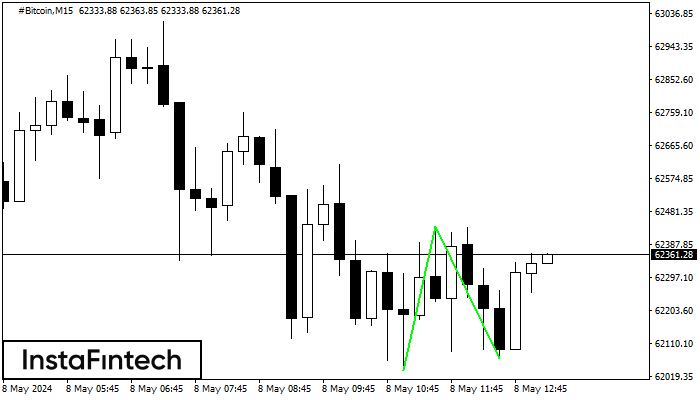
Double Bottom
The Double Bottom pattern has been formed on #Bitcoin M15; the upper boundary is 62440.00; the lower boundary is 62069.83. The width of the pattern is 40441 points. In case of a break of the upper boundary 62440.00, a change in the trend can be predicted where the width of the pattern will coincide with the distance to a possible take profit level.
#Bitcoin M5
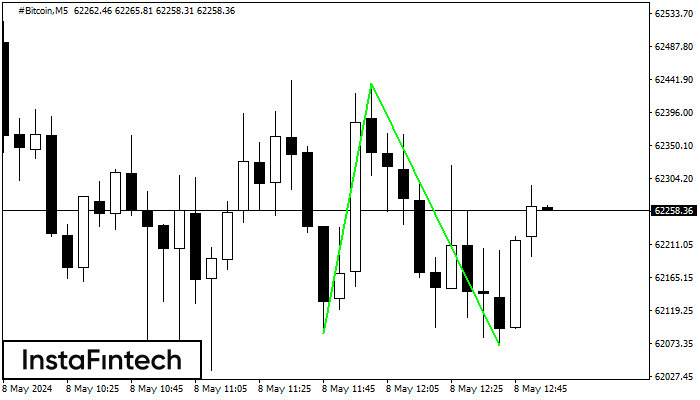
Double Bottom
The Double Bottom pattern has been formed on #Bitcoin M5; the upper boundary is 62436.42; the lower boundary is 62069.83. The width of the pattern is 34937 points. In case of a break of the upper boundary 62436.42, a change in the trend can be predicted where the width of the pattern will coincide with the distance to a possible take profit level.
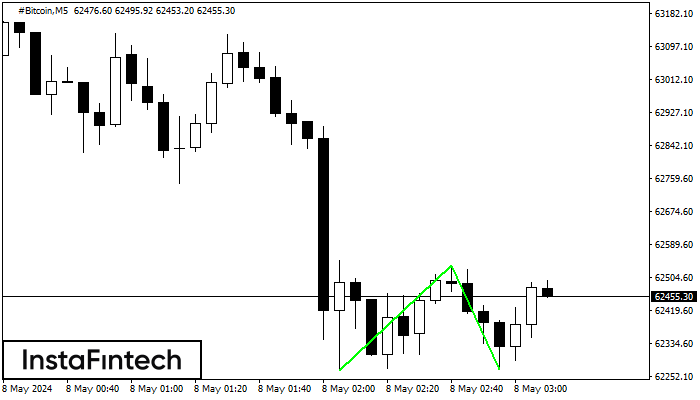
#Bitcoin M5
Double Bottom
The Double Bottom pattern has been formed on #Bitcoin M5; the upper boundary is 62535.05; the lower boundary is 62268.95. The width of the pattern is 26801 points. In case of a break of the upper boundary 62535.05, a change in the trend can be predicted where the width of the pattern will coincide with the distance to a possible take profit level.
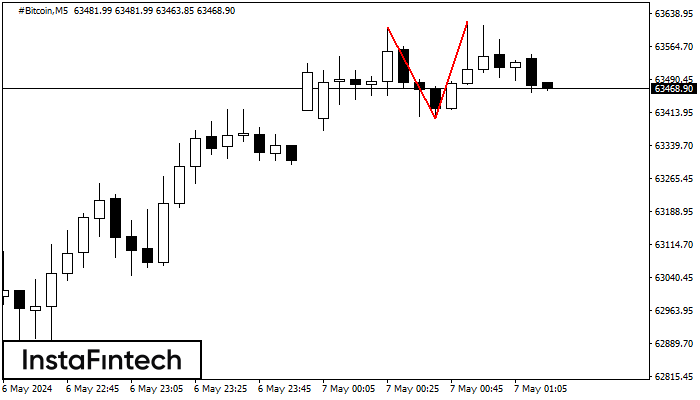
#Bitcoin M5
Double Top
The Double Top reversal pattern has been formed on #Bitcoin M5. Characteristics: the upper boundary 63607.43; the lower boundary 63400.12; the width of the pattern is 22141 points. Sell trades are better to be opened below the lower boundary 63400.12 with a possible movements towards the 63399.97 level.
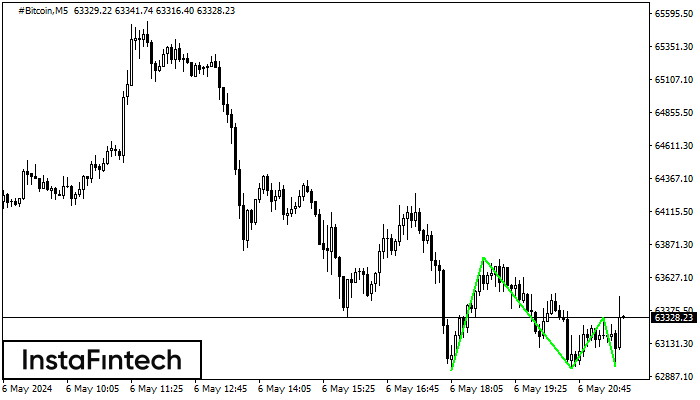
#Bitcoin M5
Triple Bottom
The Triple Bottom pattern has formed on the chart of the #Bitcoin M5 trading instrument. The pattern signals a change in the trend from downwards to upwards in the case of breakdown of 63770.65/63324.25.
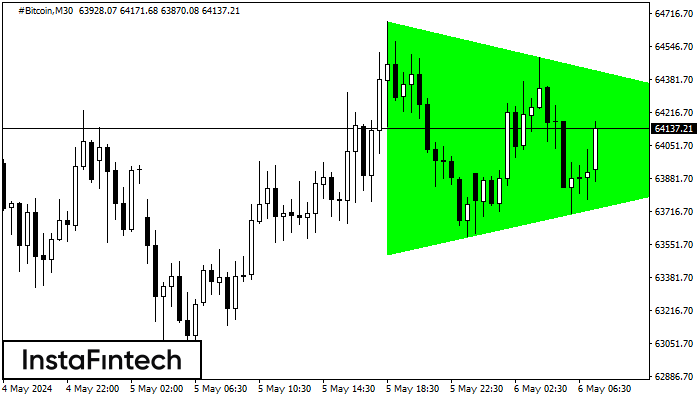
#Bitcoin M30
Bullish Symmetrical Triangle
According to the chart of M30, #Bitcoin formed the Bullish Symmetrical Triangle pattern. Description: This is the pattern of a trend continuation. 64674.79 and 63501.84 are the coordinates of the upper and lower borders respectively. The pattern width is measured on the chart at 117295 pips. Outlook: If the upper border 64674.79 is broken, the price is likely to continue its move by 64069.49.
#Bitcoin M15
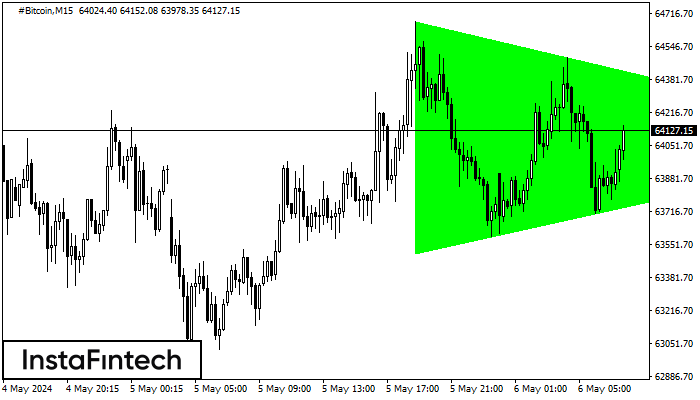
Bullish Symmetrical Triangle
According to the chart of M15, #Bitcoin formed the Bullish Symmetrical Triangle pattern. The lower border of the pattern touches the coordinates 63506.31/64071.57 whereas the upper border goes across 64674.79/64071.57. If the Bullish Symmetrical Triangle pattern is in progress, this evidently signals a further upward trend. In other words, in case the scenario comes true, the price of #Bitcoin will breach the upper border to head for 64071.80.
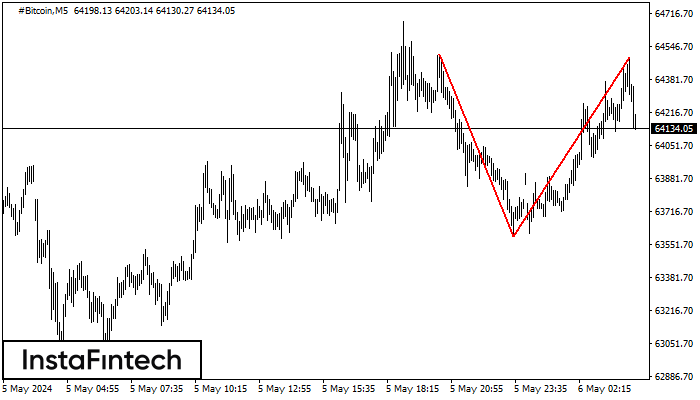
#Bitcoin M5
Double Top
On the chart of #Bitcoin M5 the Double Top reversal pattern has been formed. Characteristics: the upper boundary 64493.53; the lower boundary 63591.26; the width of the pattern 90227 points. The signal: a break of the lower boundary will cause continuation of the downward trend targeting the 63591.11 level.