 English
  Русский
 Bahasa Indonesia
 Bahasa Malay
 ไทย
ไทย Español
 Deutsch
 Български
 Français
 Tiếng Việt
 中文
中文 বাংলা
বাংলা हिन्दी
 Čeština
 Українська
 Română
FX.co ★ Patterns AUDCHF | Australian Dollar (AUD) to Swiss Franc (CHF) Rate in the Forex market

AUDCHF D1
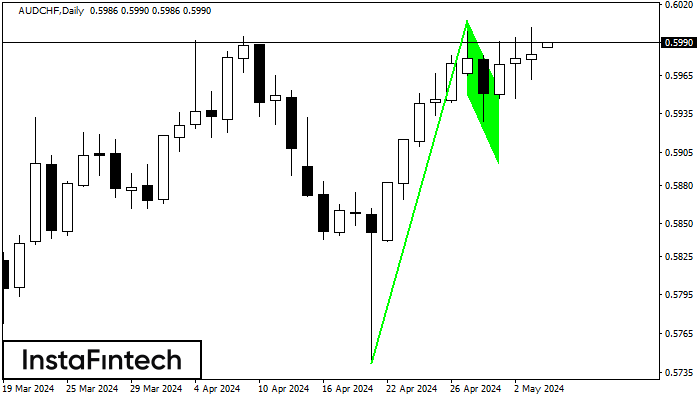
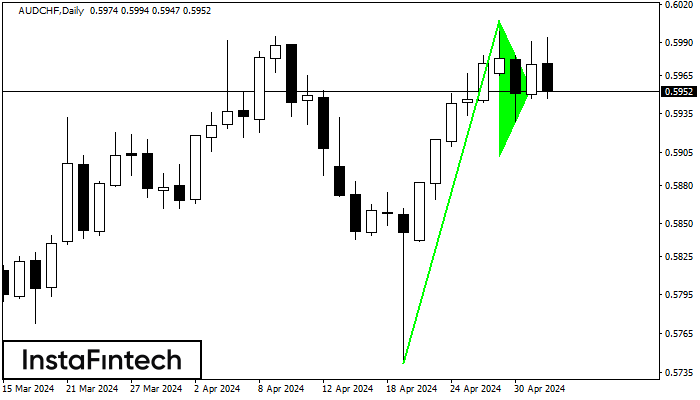
Bullish Flag
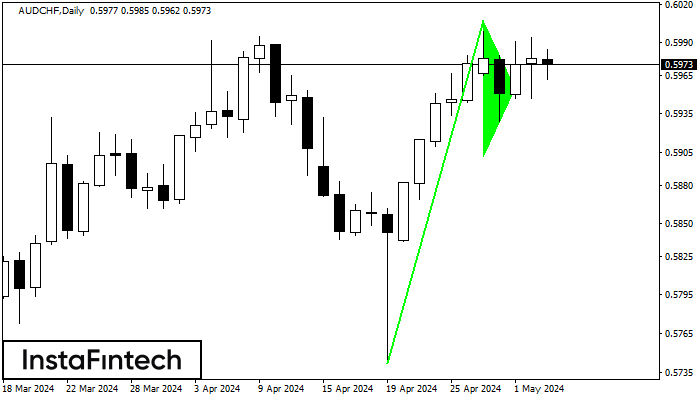
The Bullish Flag pattern which signals continuation of a trend has been formed on the chart AUDCHF D1. Forecast: if the price breaks above the pattern high at 0.6007, then traders will be able to place a long deal with the target at 0.6047.
AUDCHF D1
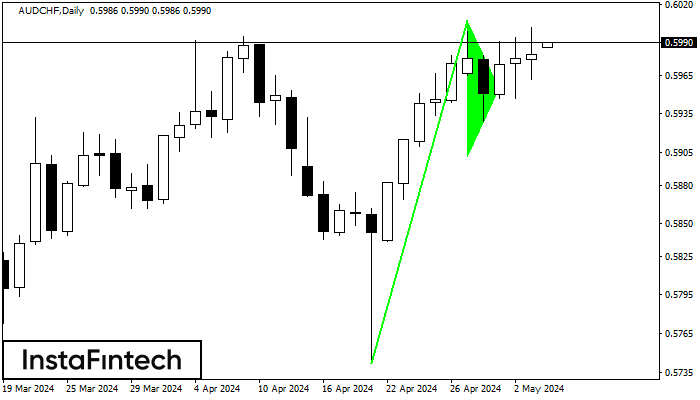
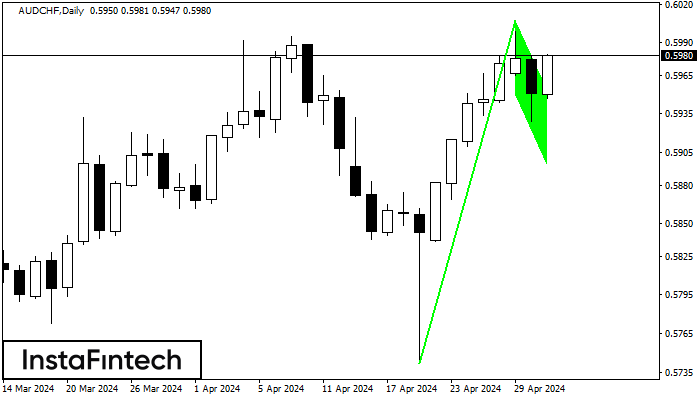
Bullish pennant
The Bullish pennant pattern is formed on the AUDCHF D1 chart. It is a type of the continuation pattern. Supposedly, in case the price is fixed above the pennant’s high of 0.6007, a further uptrend is possible.
AUDCHF H1
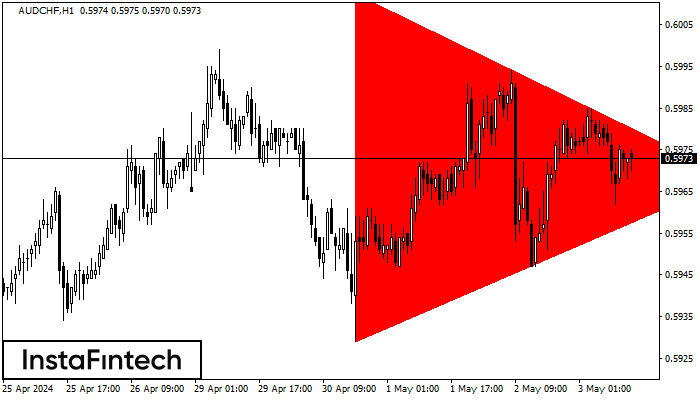
Bearish Symmetrical Triangle
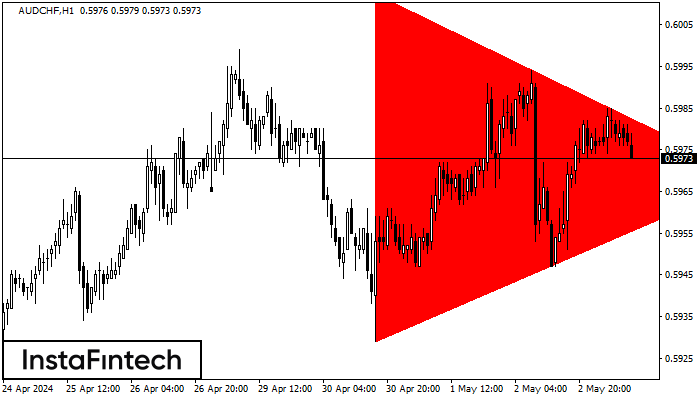
According to the chart of H1, AUDCHF formed the Bearish Symmetrical Triangle pattern. This pattern signals a further downward trend in case the lower border 0.5929 is breached. Here, a hypothetical profit will equal the width of the available pattern that is -83 pips.
AUDCHF D1
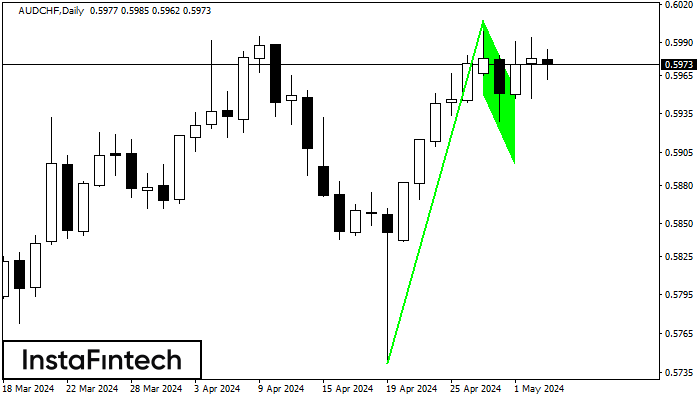
Bullish Flag
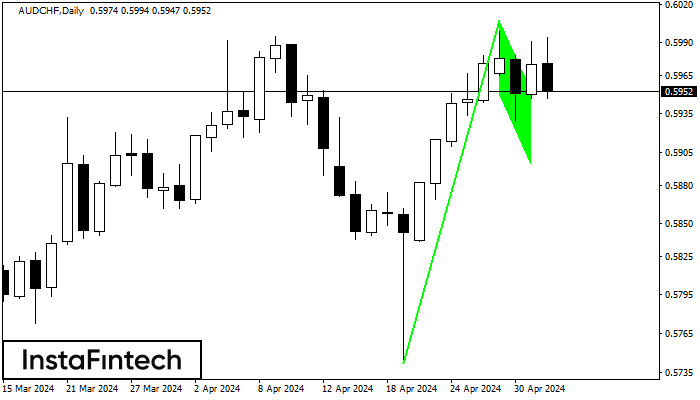
The Bullish Flag pattern has been formed on the chart AUDCHF D1 which signals that the upward trend will continue. Signals: а break of the peak at 0.6007 may push the price higher, and the rise will be the projection of the pole.
AUDCHF D1
Bullish pennant
The Bullish pennant graphic pattern has formed on the AUDCHF D1 instrument. This pattern type falls under the category of continuation patterns. In this case, if the quote can breaks out high, is expected to continue the upward trend to level 0.6047.
AUDCHF H1
Bearish Symmetrical Triangle
According to the chart of H1, AUDCHF formed the Bearish Symmetrical Triangle pattern. Trading recommendations: A breach of the lower border 0.5929 is likely to encourage a continuation of the downward trend.
AUDCHF M15
Head and Shoulders
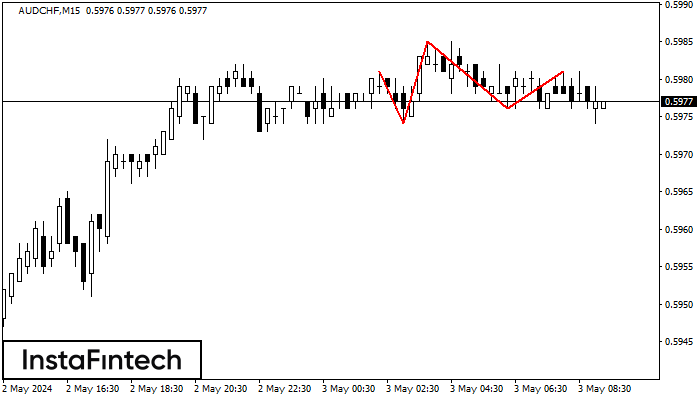
The technical pattern called Head and Shoulders has appeared on the chart of AUDCHF M15. There are weighty reasons to suggest that the price will surpass the Neckline 0.5974/0.5976 after the right shoulder has been formed. So, the trend is set to change with the price heading for 0.5954.
AUDCHF D1
Bullish Flag
The Bullish Flag pattern which signals continuation of a trend has been formed on the chart AUDCHF D1. Forecast: if the price breaks above the pattern high at 0.6007, then traders will be able to place a long deal with the target at 0.6047.
AUDCHF D1
Bullish pennant
The Bullish pennant signal – Trading instrument AUDCHF D1, continuation pattern. Forecast: it is possible to set up a buy position above the pattern’s high of 0.6007, with the prospect of the next move being a projection of the flagpole height.
AUDCHF D1
Bullish Flag
The Bullish Flag pattern which signals continuation of a trend has been formed on the chart AUDCHF D1. Forecast: if the price breaks above the pattern high at 0.6007, then traders will be able to place a long deal with the target at 0.6047.