 English
  Русский
 Bahasa Indonesia
 Bahasa Malay
 ไทย
ไทย Español
 Deutsch
 Български
 Français
 Tiếng Việt
 中文
中文 বাংলা
বাংলা हिन्दी
 Čeština
 Українська
 Română
FX.co ★ Patterns #AMZN | Amazon.com, Inc. Stock Price

#AMZN M5
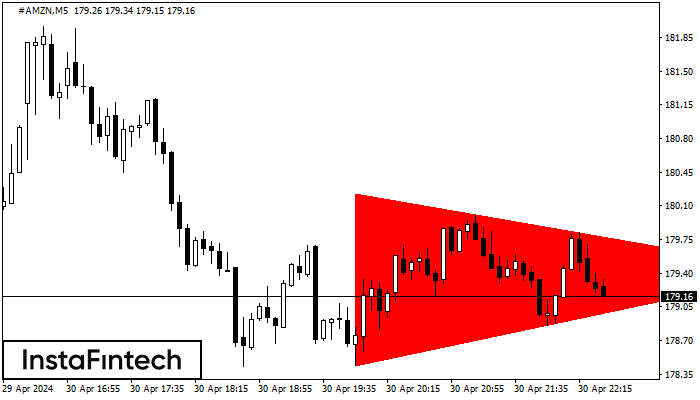
Bearish Symmetrical Triangle
According to the chart of M5, #AMZN formed the Bearish Symmetrical Triangle pattern. Trading recommendations: A breach of the lower border 178.44 is likely to encourage a continuation of the downward trend.
#AMZN M5
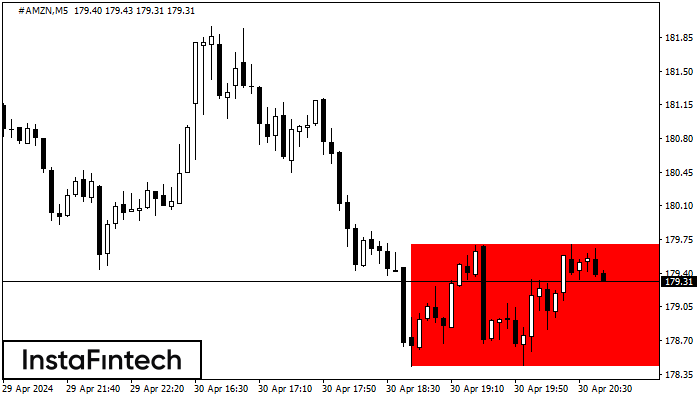
Bearish Rectangle
According to the chart of M5, #AMZN formed the Bearish Rectangle which is a pattern of a trend continuation. The pattern is contained within the following borders: lower border 178.43 – 178.43 and upper border 179.70 – 179.70. In case the lower border is broken, the instrument is likely to follow the downward trend.
#AMZN M5
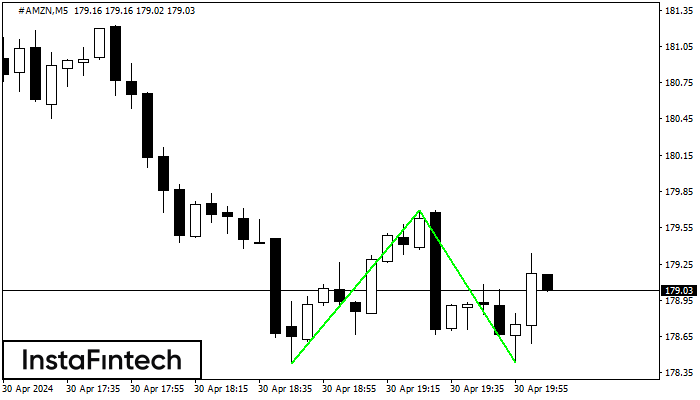
Double Bottom
The Double Bottom pattern has been formed on #AMZN M5; the upper boundary is 179.69; the lower boundary is 178.44. The width of the pattern is 126 points. In case of a break of the upper boundary 179.69, a change in the trend can be predicted where the width of the pattern will coincide with the distance to a possible take profit level.
#AMZN M15
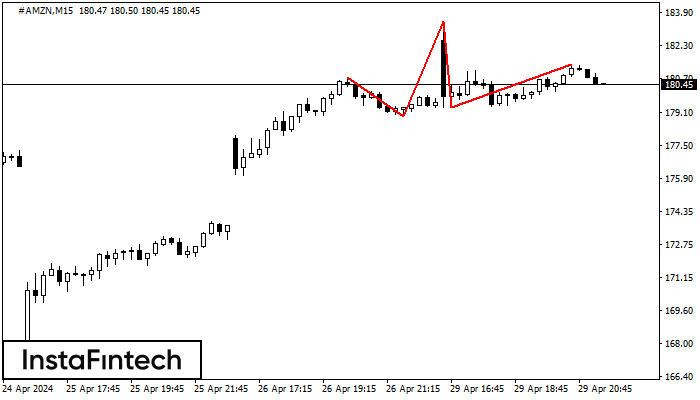
Head and Shoulders
The technical pattern called Head and Shoulders has appeared on the chart of #AMZN M15. There are weighty reasons to suggest that the price will surpass the Neckline 178.92/179.33 after the right shoulder has been formed. So, the trend is set to change with the price heading for 179.10.
#AMZN M30
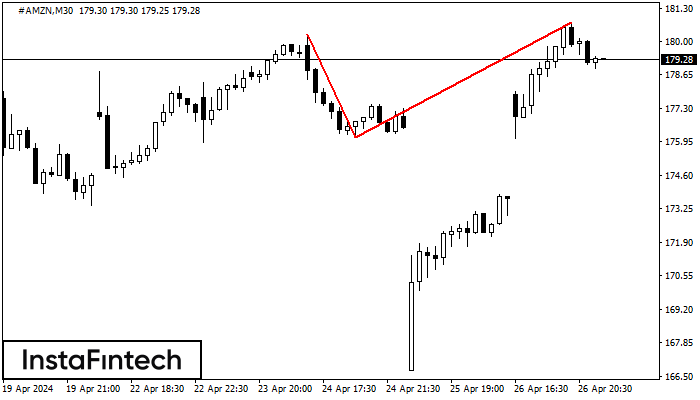
Double Top
The Double Top reversal pattern has been formed on #AMZN M30. Characteristics: the upper boundary 180.26; the lower boundary 176.12; the width of the pattern is 463 points. Sell trades are better to be opened below the lower boundary 176.12 with a possible movements towards the 175.82 level.
#AMZN M5
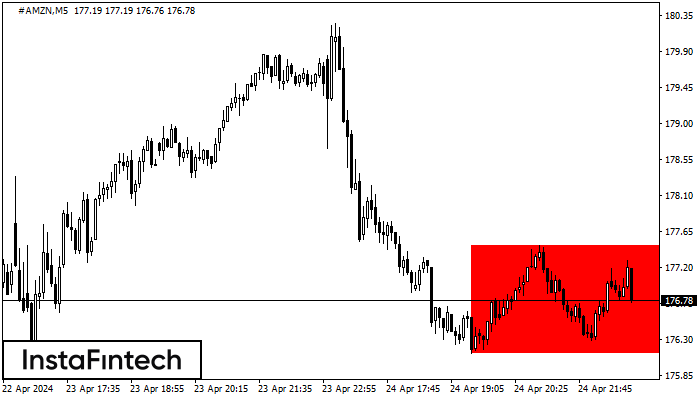
Bearish Rectangle
According to the chart of M5, #AMZN formed the Bearish Rectangle. This type of a pattern indicates a trend continuation. It consists of two levels: resistance 177.47 - 0.00 and support 176.12 – 176.12. In case the resistance level 176.12 - 176.12 is broken, the instrument is likely to follow the bearish trend.
#AMZN M5
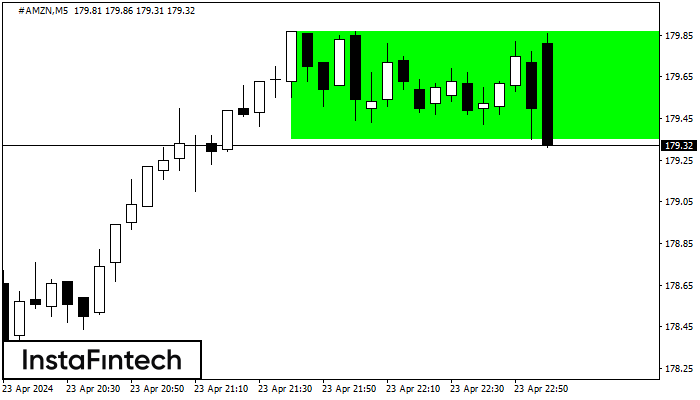
Bullish Rectangle
According to the chart of M5, #AMZN formed the Bullish Rectangle. The pattern indicates a trend continuation. The upper border is 179.87, the lower border is 179.35. The signal means that a long position should be opened above the upper border 179.87 of the Bullish Rectangle.
#AMZN M5
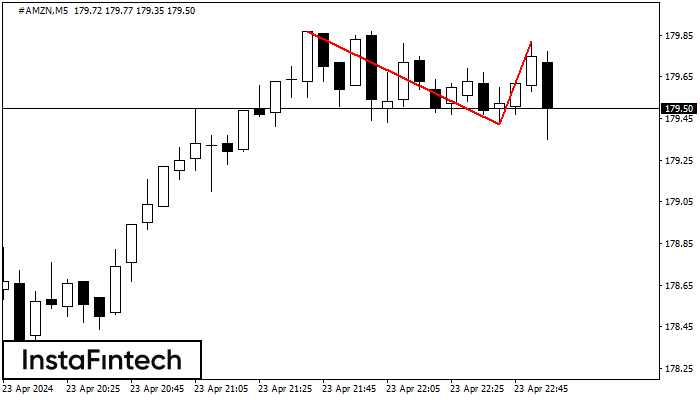
Double Top
The Double Top pattern has been formed on #AMZN M5. It signals that the trend has been changed from upwards to downwards. Probably, if the base of the pattern 179.42 is broken, the downward movement will continue.
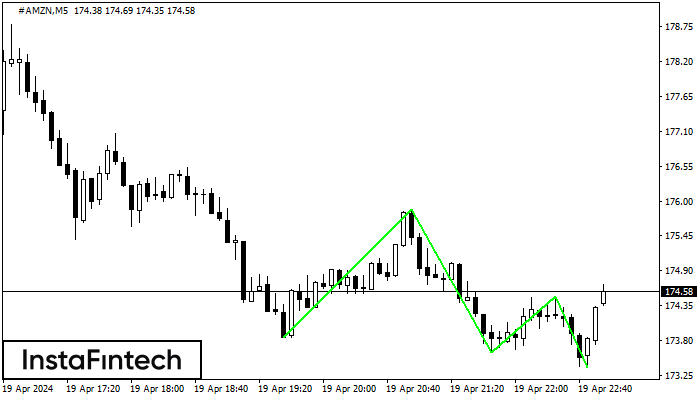
#AMZN M5
Triple Bottom
The Triple Bottom pattern has been formed on #AMZN M5. It has the following characteristics: resistance level 175.86/174.50; support level 173.86/173.38; the width is 200 points. In the event of a breakdown of the resistance level of 175.86, the price is likely to continue an upward movement at least to 173.77.
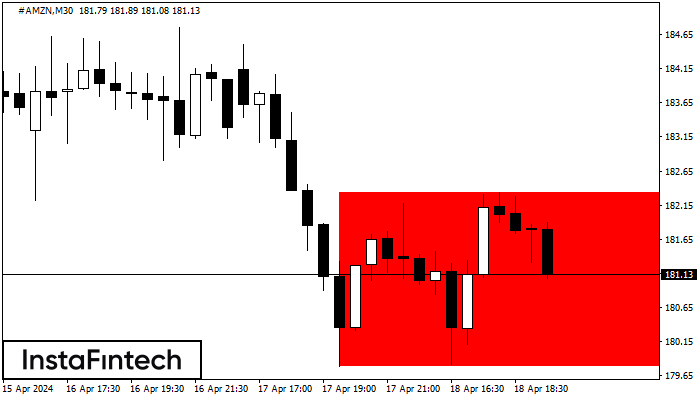
#AMZN M30
Bearish Rectangle
According to the chart of M30, #AMZN formed the Bearish Rectangle which is a pattern of a trend continuation. The pattern is contained within the following borders: lower border 179.78 – 179.78 and upper border 182.33 – 182.33. In case the lower border is broken, the instrument is likely to follow the downward trend.