 中文
中文  Русский
 English
 Bahasa Indonesia
 Bahasa Malay
 ไทย
ไทย Español
 Deutsch
 Български
 Français
 Tiếng Việt
 বাংলা
বাংলা हिन्दी
 Čeština
 Українська
 Română
FX.co ★ Patterns USDJPY | US Dollar (USD) to Japanese Yen (JPY) Rate in the Forex market

USDJPY M5
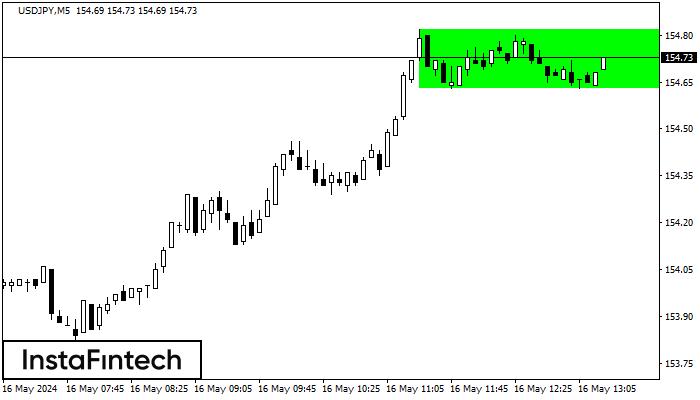
Bullish Rectangle
According to the chart of M5, USDJPY formed the Bullish Rectangle. The pattern indicates a trend continuation. The upper border is 154.82, the lower border is 154.63. The signal means that a long position should be opened above the upper border 154.82 of the Bullish Rectangle.
USDJPY M30
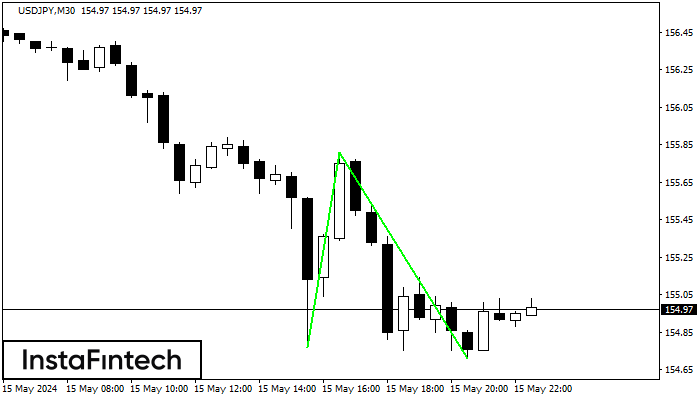
Double Bottom
The Double Bottom pattern has been formed on USDJPY M30. Characteristics: the support level 154.77; the resistance level 155.81; the width of the pattern 104 points. If the resistance level is broken, a change in the trend can be predicted with the first target point lying at the distance of 110 points.
USDJPY M5
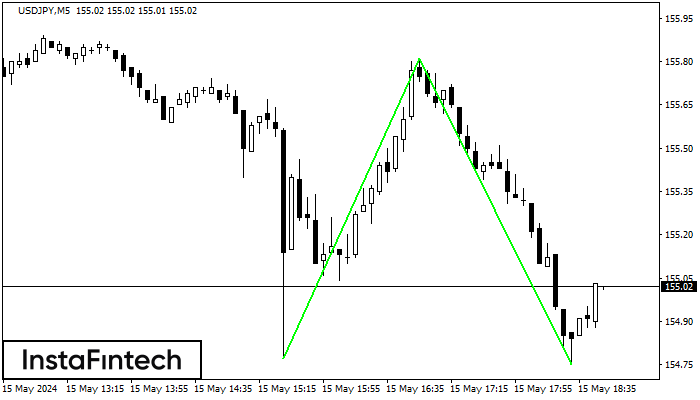
Double Bottom
The Double Bottom pattern has been formed on USDJPY M5; the upper boundary is 155.81; the lower boundary is 154.75. The width of the pattern is 104 points. In case of a break of the upper boundary 155.81, a change in the trend can be predicted where the width of the pattern will coincide with the distance to a possible take profit level.
USDJPY M5
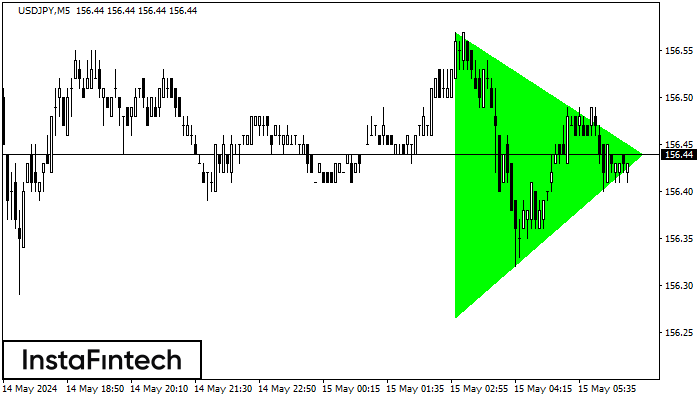
Bullish Symmetrical Triangle
According to the chart of M5, USDJPY formed the Bullish Symmetrical Triangle pattern. The lower border of the pattern touches the coordinates 156.27/156.44 whereas the upper border goes across 156.57/156.44. If the Bullish Symmetrical Triangle pattern is in progress, this evidently signals a further upward trend. In other words, in case the scenario comes true, the price of USDJPY will breach the upper border to head for 156.59.
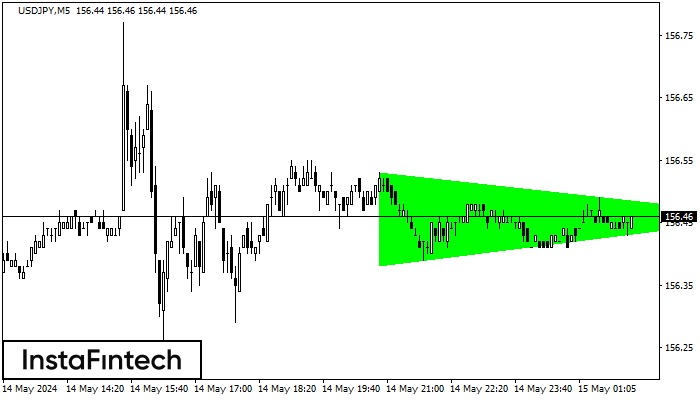
USDJPY M5
Bullish Symmetrical Triangle
According to the chart of M5, USDJPY formed the Bullish Symmetrical Triangle pattern. Description: This is the pattern of a trend continuation. 156.53 and 156.38 are the coordinates of the upper and lower borders respectively. The pattern width is measured on the chart at 15 pips. Outlook: If the upper border 156.53 is broken, the price is likely to continue its move by 156.61.
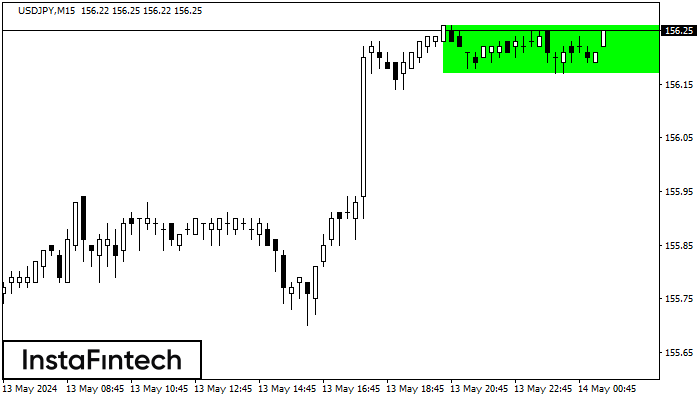
USDJPY M15
Bullish Rectangle
According to the chart of M15, USDJPY formed the Bullish Rectangle. This type of a pattern indicates a trend continuation. It consists of two levels: resistance 156.26 and support 156.17. In case the resistance level 156.26 - 156.26 is broken, the instrument is likely to follow the bullish trend.
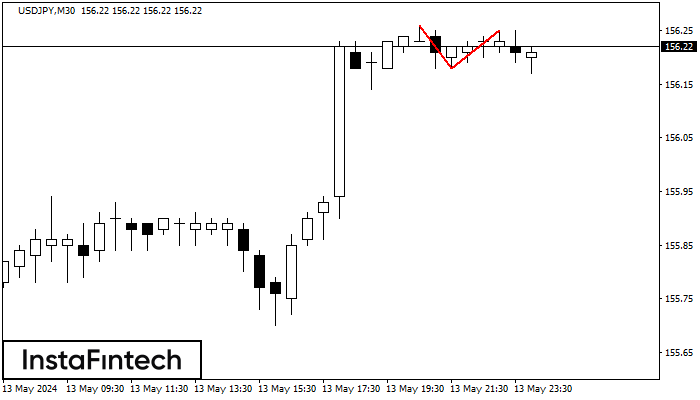
USDJPY M30
Double Top
The Double Top pattern has been formed on USDJPY M30. It signals that the trend has been changed from upwards to downwards. Probably, if the base of the pattern 156.18 is broken, the downward movement will continue.
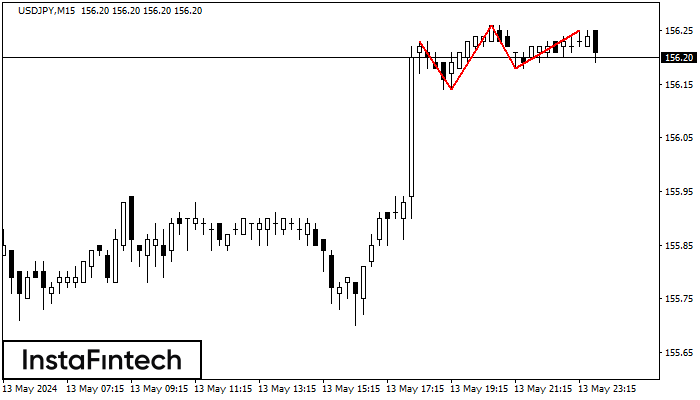
USDJPY M15
Triple Top
The Triple Top pattern has formed on the chart of the USDJPY M15. Features of the pattern: borders have an ascending angle; the lower line of the pattern has the coordinates 156.14/156.18 with the upper limit 156.23/156.25; the projection of the width is 9 points. The formation of the Triple Top figure most likely indicates a change in the trend from upward to downward. This means that in the event of a breakdown of the support level of 156.14, the price is most likely to continue the downward movement.
USDJPY M5
Bullish Flag
The Bullish Flag pattern has been formed on the chart USDJPY M5 which signals that the upward trend will continue. Signals: а break of the peak at 155.95 may push the price higher, and the rise will be the projection of the pole.

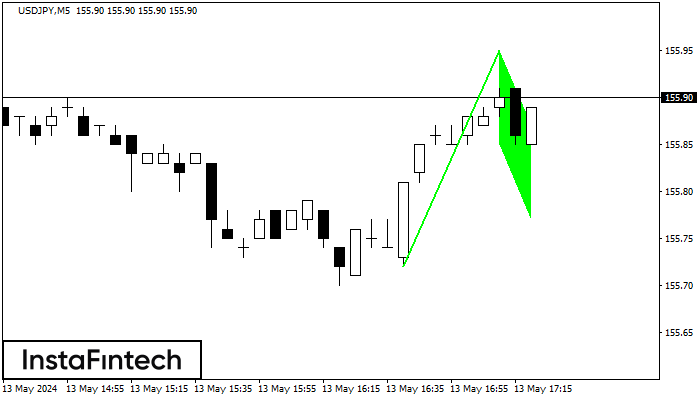
USDJPY M5
Bullish pennant
The Bullish pennant graphic pattern has formed on the USDJPY M5 instrument. This pattern type falls under the category of continuation patterns. In this case, if the quote can breaks out high, is expected to continue the upward trend to level 156.10.