 中文
中文  Русский
 English
 Bahasa Indonesia
 Bahasa Malay
 ไทย
ไทย Español
 Deutsch
 Български
 Français
 Tiếng Việt
 বাংলা
বাংলা हिन्दी
 Čeština
 Українська
 Română
FX.co ★ Patterns USDCHF | US Dollar (USD) to Swiss Franc (CHF) Rate in the Forex market

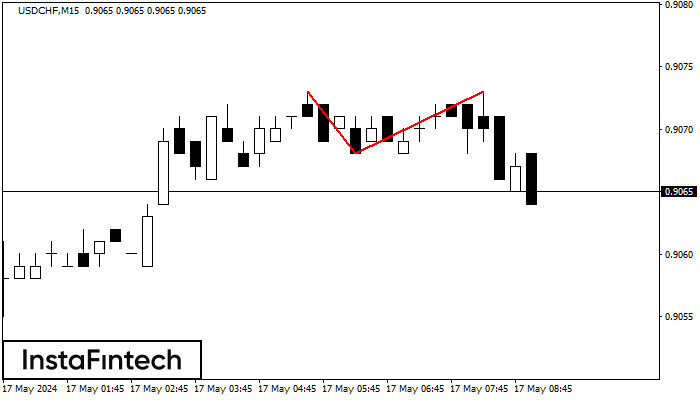
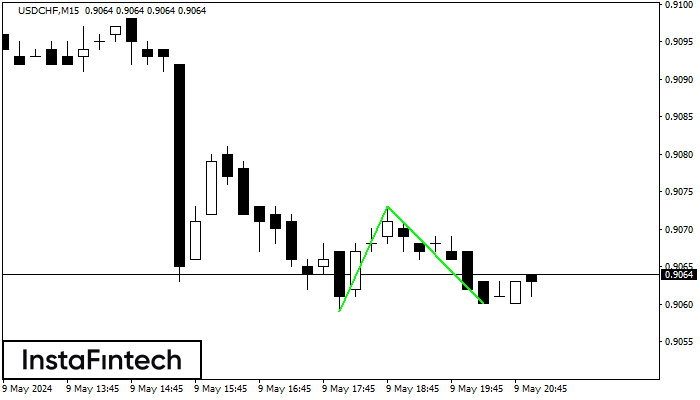
USDCHF M15
Double Top
The Double Top reversal pattern has been formed on USDCHF M15. Characteristics: the upper boundary 0.9073; the lower boundary 0.9068; the width of the pattern is 5 points. Sell trades are better to be opened below the lower boundary 0.9068 with a possible movements towards the 0.9046 level.
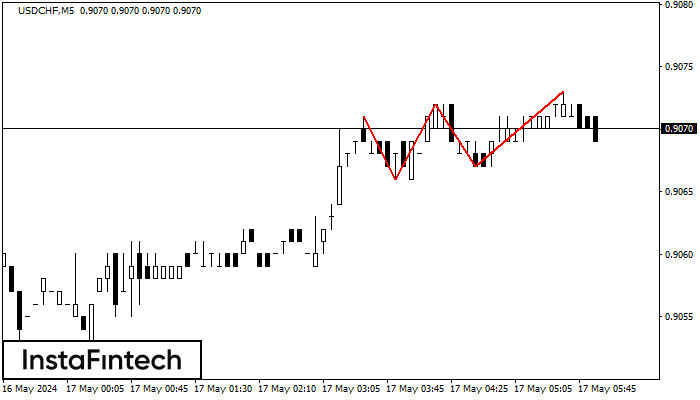
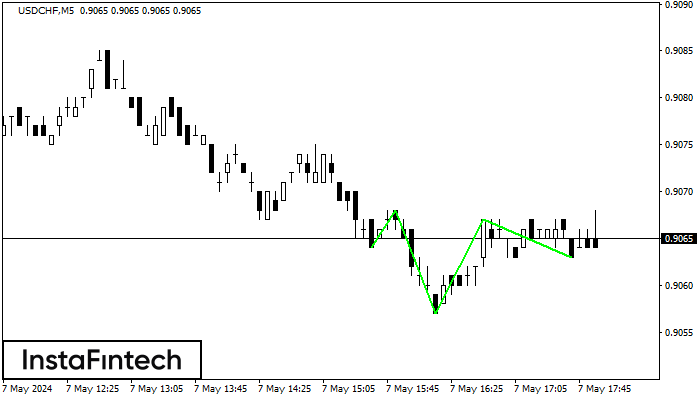
USDCHF M5
Triple Top
The Triple Top pattern has formed on the chart of the USDCHF M5. Features of the pattern: borders have an ascending angle; the lower line of the pattern has the coordinates 0.9066/0.9067 with the upper limit 0.9071/0.9073; the projection of the width is 5 points. The formation of the Triple Top figure most likely indicates a change in the trend from upward to downward. This means that in the event of a breakdown of the support level of 0.9066, the price is most likely to continue the downward movement.
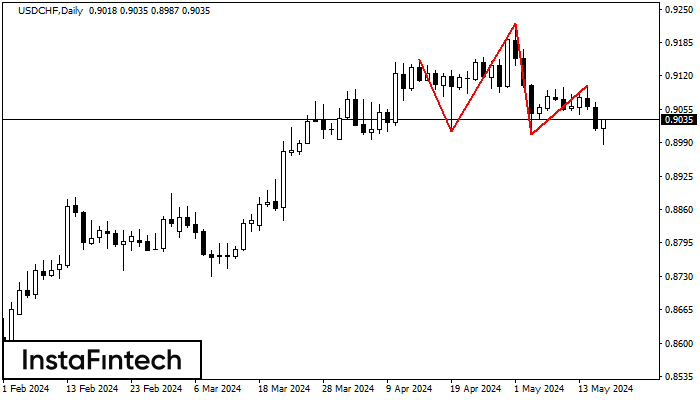
USDCHF D1
Head and Shoulders
The USDCHF D1 formed the Head and Shoulders pattern with the following features: The Head’s top is at 0.9223, the Neckline and the upward angle are at 0.9011/0.9006. The formation of this pattern can bring about changes in the current trend from bullish to bearish. In case the pattern triggers the expected changes, the price of USDCHF will go towards 0.8966.
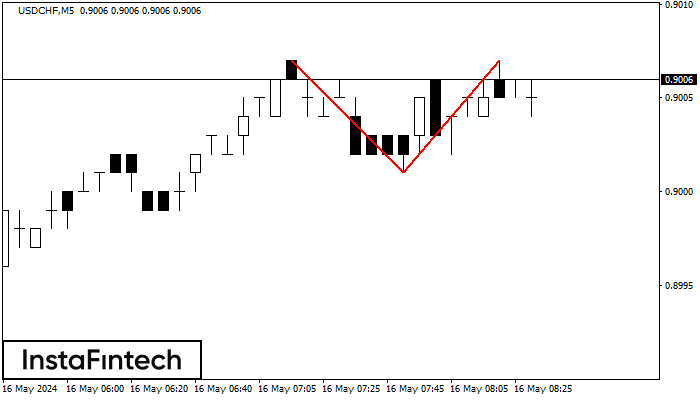
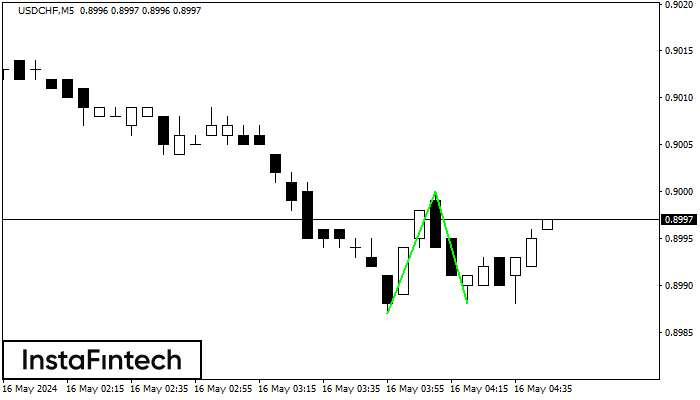
USDCHF M5
Double Top
The Double Top pattern has been formed on USDCHF M5. It signals that the trend has been changed from upwards to downwards. Probably, if the base of the pattern 0.9001 is broken, the downward movement will continue.
USDCHF M5
Double Bottom
The Double Bottom pattern has been formed on USDCHF M5. Characteristics: the support level 0.8987; the resistance level 0.9000; the width of the pattern 13 points. If the resistance level is broken, a change in the trend can be predicted with the first target point lying at the distance of 12 points.
USDCHF M15
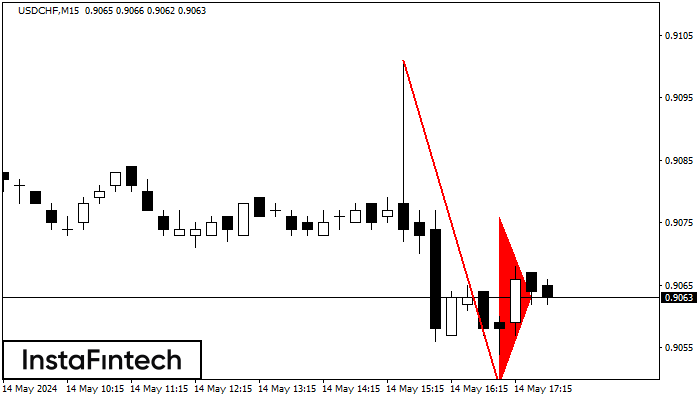
Bearish Flag
The Bearish Flag pattern has been formed on the chart USDCHF M15 which signals that the downward trend will continue. If the price breaks below the low at 0.9049, then it is most likely to move further downwards. The price will likely move by the number of points which equals the length of the flag pole (15 points).
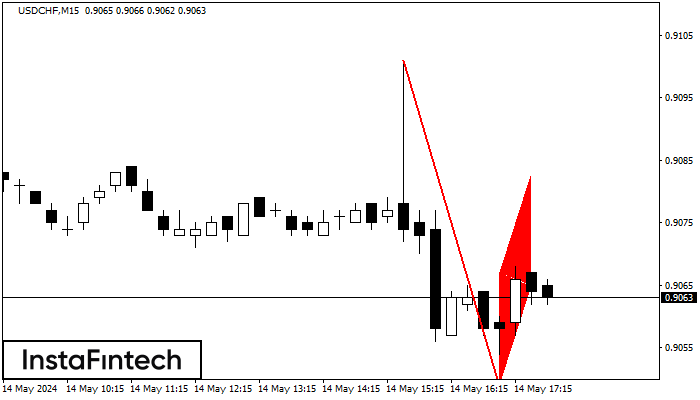
USDCHF M15
Bearish pennant
The Bearish pennant pattern has formed on the USDCHF M15 chart. This pattern type is characterized by a slight slowdown after which the price will move in the direction of the original trend. In case the price fixes below the pattern’s low of 0.9049, a trader will be able to successfully enter the sell position.
USDCHF M5
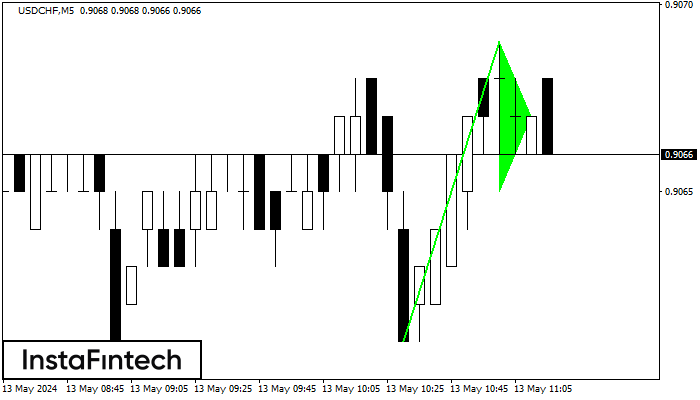
Bullish pennant
The Bullish pennant signal – Trading instrument USDCHF M5, continuation pattern. Forecast: it is possible to set up a buy position above the pattern’s high of 0.9069, with the prospect of the next move being a projection of the flagpole height.
USDCHF M15
Double Bottom
The Double Bottom pattern has been formed on USDCHF M15. Characteristics: the support level 0.9059; the resistance level 0.9073; the width of the pattern 14 points. If the resistance level is broken, a change in the trend can be predicted with the first target point lying at the distance of 13 points.
USDCHF M5
Inverse Head and Shoulder
According to the chart of M5, USDCHF formed the Inverse Head and Shoulder pattern. The Head’s top is set at 0.9067 while the median line of the Neck is found at 0.9057/0.9063. The formation of the Inverse Head and Shoulder pattern evidently signals a reversal of the downward trend. In other words, in case the scenario comes true, the price of USDCHF will go towards 0.9082