 中文
中文  Русский
 English
 Bahasa Indonesia
 Bahasa Malay
 ไทย
ไทย Español
 Deutsch
 Български
 Français
 Tiếng Việt
 বাংলা
বাংলা हिन्दी
 Čeština
 Українська
 Română
FX.co ★ Patterns SILVER | Silver Rate in the Forex market

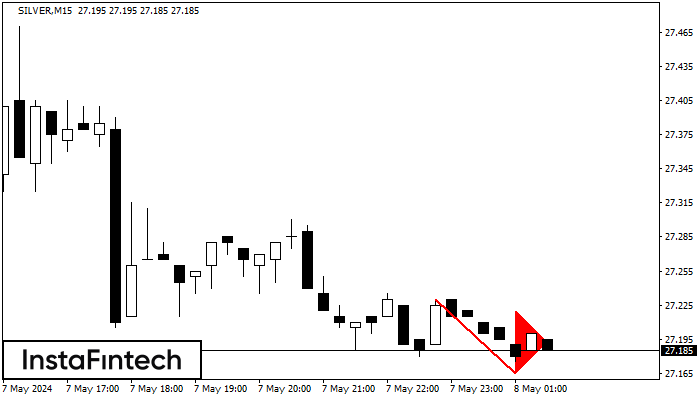
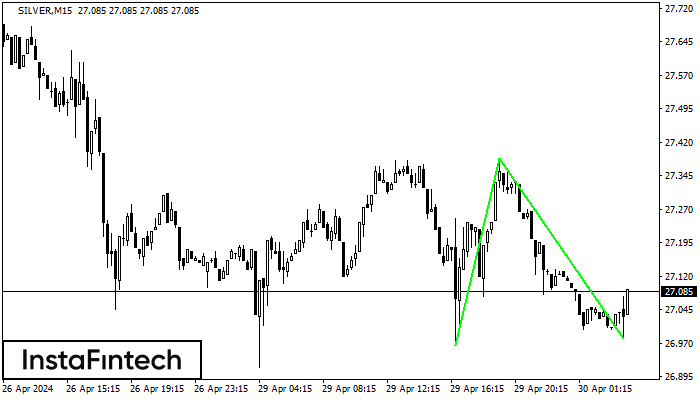
SILVER M15
Bearish pennant
The Bearish pennant pattern has formed on the SILVER M15 chart. It signals potential continuation of the existing trend. Specifications: the pattern’s bottom has the coordinate of 27.16; the projection of the flagpole height is equal to 65 pips. In case the price breaks out the pattern’s bottom of 27.16, the downtrend is expected to continue for further level 27.14.
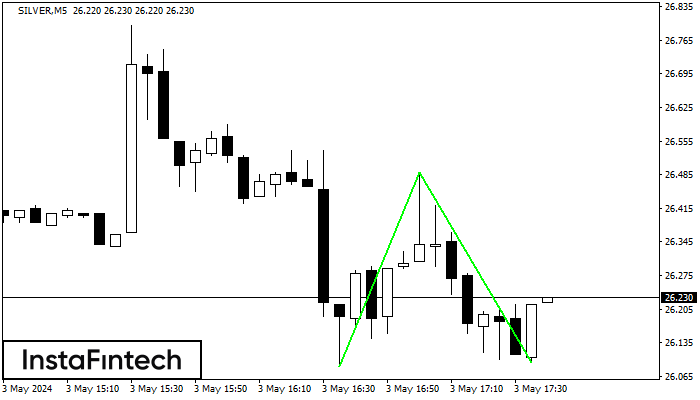
SILVER M5
Double Bottom
The Double Bottom pattern has been formed on SILVER M5. This formation signals a reversal of the trend from downwards to upwards. The signal is that a buy trade should be opened after the upper boundary of the pattern 26.49 is broken. The further movements will rely on the width of the current pattern 405 points.
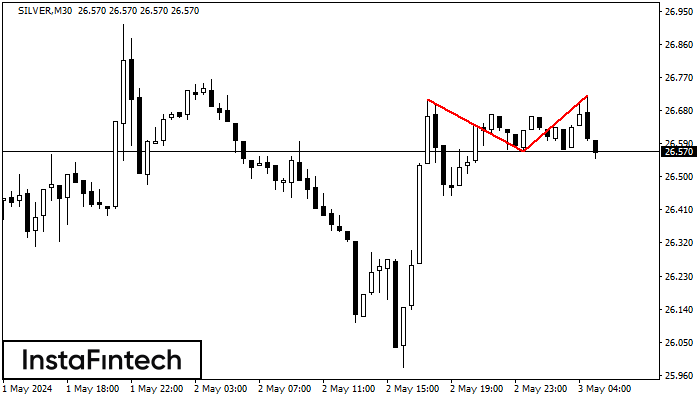
SILVER M30
Double Top
On the chart of SILVER M30 the Double Top reversal pattern has been formed. Characteristics: the upper boundary 26.72; the lower boundary 26.57; the width of the pattern 150 points. The signal: a break of the lower boundary will cause continuation of the downward trend targeting the 26.54 level.
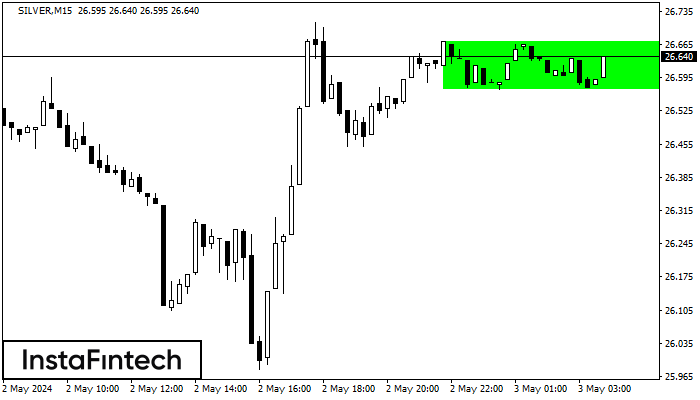
SILVER M15
Bullish Symmetrical Triangle
According to the chart of M15, SILVER formed the Bullish Symmetrical Triangle pattern. The lower border of the pattern touches the coordinates 26.57/26.61 whereas the upper border goes across 26.67/26.61. If the Bullish Symmetrical Triangle pattern is in progress, this evidently signals a further upward trend. In other words, in case the scenario comes true, the price of SILVER will breach the upper border to head for 26.64.
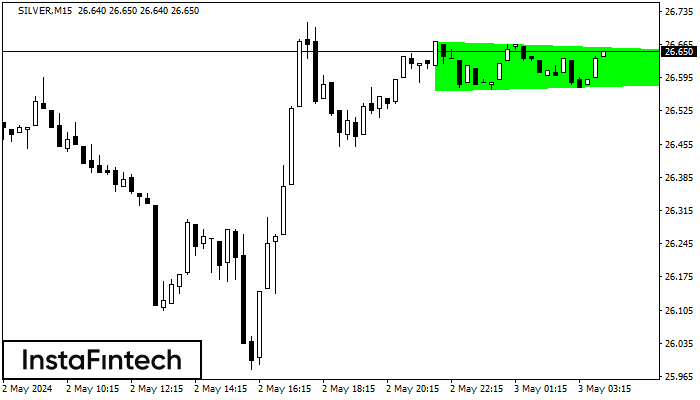
SILVER M15
Bullish Rectangle
According to the chart of M15, SILVER formed the Bullish Rectangle. This type of a pattern indicates a trend continuation. It consists of two levels: resistance 26.67 and support 26.57. In case the resistance level 26.67 - 26.67 is broken, the instrument is likely to follow the bullish trend.
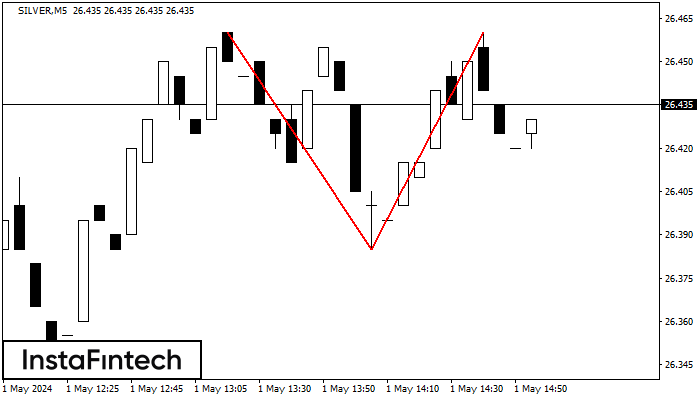
SILVER M5
Inverse Head and Shoulder
According to M5, SILVER is shaping the technical pattern – the Inverse Head and Shoulder. In case the Neckline 26.27/26.30 is broken out, the instrument is likely to move toward 26.32.
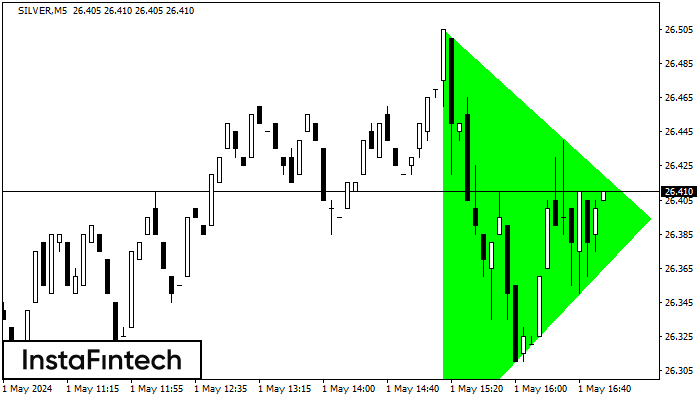
SILVER M5
Bullish Symmetrical Triangle
According to the chart of M5, SILVER formed the Bullish Symmetrical Triangle pattern. Description: This is the pattern of a trend continuation. 26.50 and 26.27 are the coordinates of the upper and lower borders respectively. The pattern width is measured on the chart at 240 pips. Outlook: If the upper border 26.50 is broken, the price is likely to continue its move by 26.41.
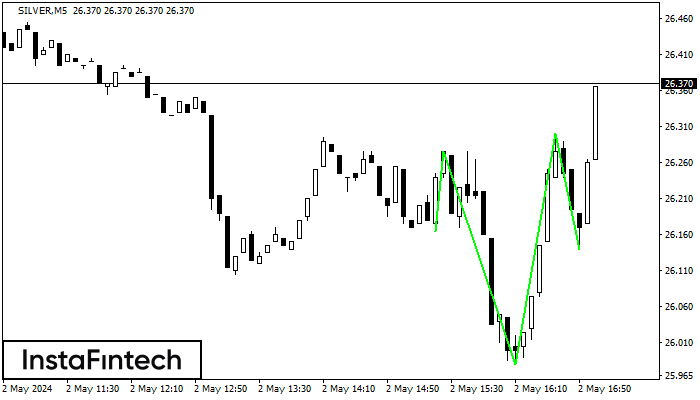
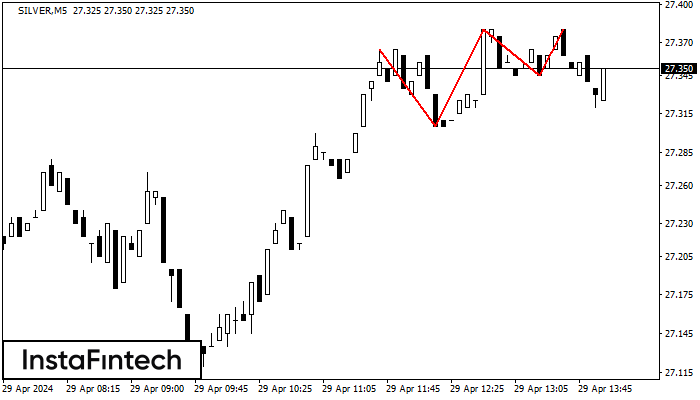
SILVER M5
Double Top
The Double Top pattern has been formed on SILVER M5. It signals that the trend has been changed from upwards to downwards. Probably, if the base of the pattern 26.39 is broken, the downward movement will continue.
SILVER M15
Double Bottom
The Double Bottom pattern has been formed on SILVER M15; the upper boundary is 27.39; the lower boundary is 26.98. The width of the pattern is 420 points. In case of a break of the upper boundary 27.39, a change in the trend can be predicted where the width of the pattern will coincide with the distance to a possible take profit level.
SILVER M5
Triple Top
The Triple Top pattern has formed on the chart of the SILVER M5 trading instrument. It is a reversal pattern featuring the following characteristics: resistance level -15, support level -40, and pattern’s width 60. Forecast If the price breaks through the support level 27.30, it is likely to move further down to 27.36.