 中文
中文  Русский
 English
 Bahasa Indonesia
 Bahasa Malay
 ไทย
ไทย Español
 Deutsch
 Български
 Français
 Tiếng Việt
 বাংলা
বাংলা हिन्दी
 Čeština
 Українська
 Română
FX.co ★ Patterns #GOOG | Alphabet Inc. Stock Price

#GOOG M5
Double Top
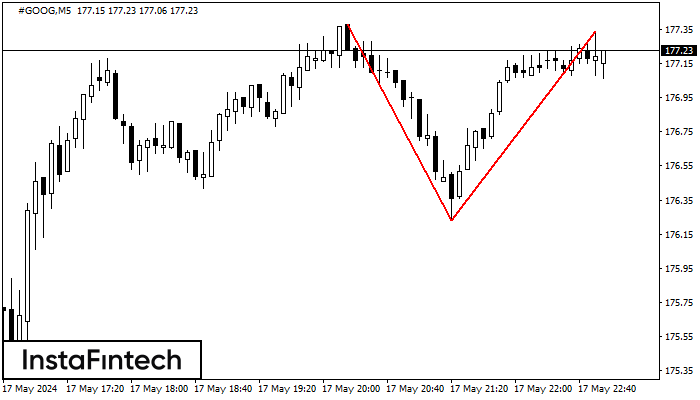
The Double Top pattern has been formed on #GOOG M5. It signals that the trend has been changed from upwards to downwards. Probably, if the base of the pattern 176.23 is broken, the downward movement will continue.

#GOOG M5
Double Top
The Double Top reversal pattern has been formed on #GOOG M5. Characteristics: the upper boundary 177.38; the lower boundary 176.23; the width of the pattern is 111 points. Sell trades are better to be opened below the lower boundary 176.23 with a possible movements towards the 176.08 level.
#GOOG H1
Bullish pennant
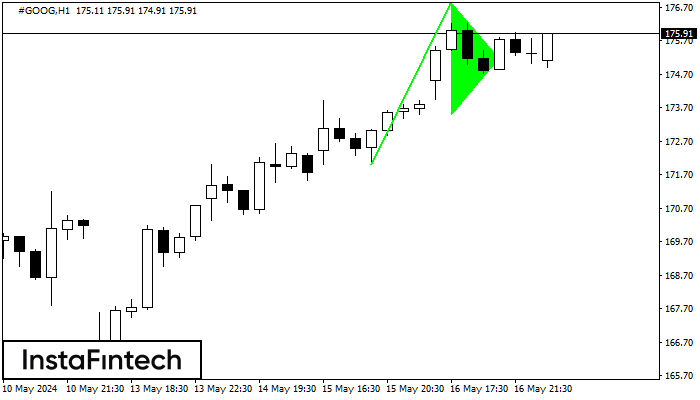
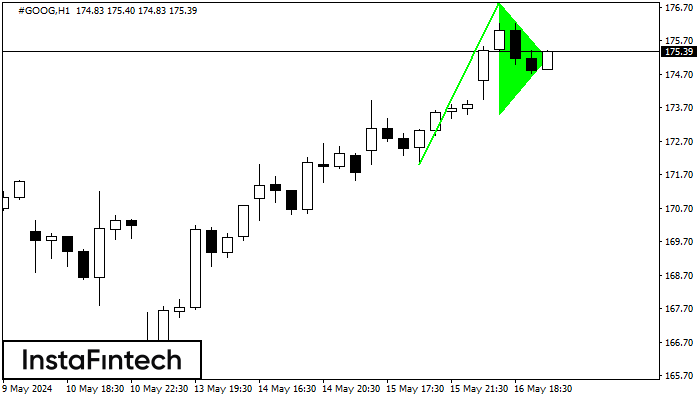
The Bullish pennant graphic pattern has formed on the #GOOG H1 instrument. This pattern type falls under the category of continuation patterns. In this case, if the quote can breaks out high, is expected to continue the upward trend to level 177.23.
#GOOG H1
Bullish pennant
The Bullish pennant signal – Trading instrument #GOOG H1, continuation pattern. Forecast: it is possible to set up a buy position above the pattern’s high of 176.83, with the prospect of the next move being a projection of the flagpole height.
#GOOG M5
Double Top
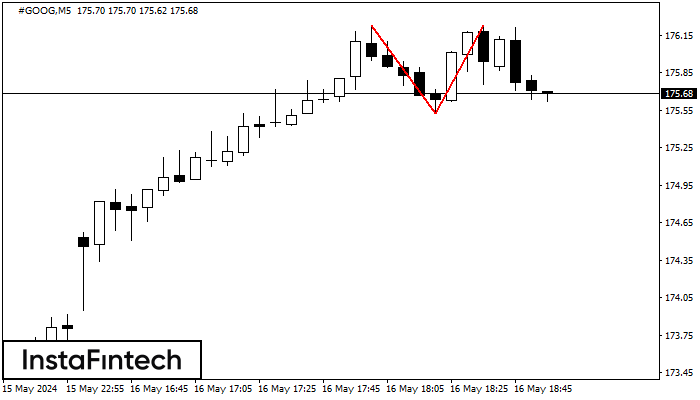
On the chart of #GOOG M5 the Double Top reversal pattern has been formed. Characteristics: the upper boundary 176.23; the lower boundary 175.52; the width of the pattern 71 points. The signal: a break of the lower boundary will cause continuation of the downward trend targeting the 175.37 level.
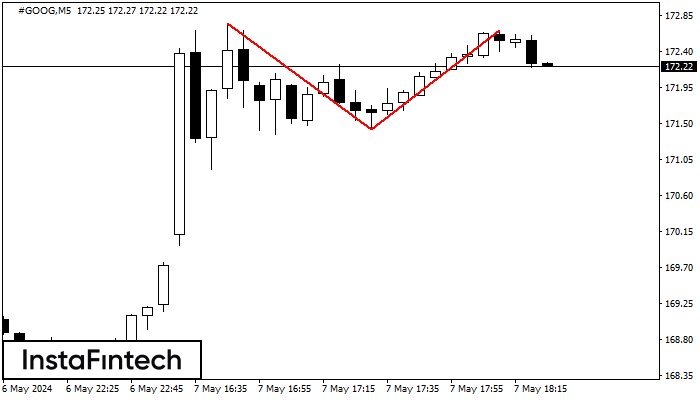
#GOOG M5
Double Bottom
The Double Bottom pattern has been formed on #GOOG M5; the upper boundary is 172.57; the lower boundary is 172.07. The width of the pattern is 47 points. In case of a break of the upper boundary 172.57, a change in the trend can be predicted where the width of the pattern will coincide with the distance to a possible take profit level.
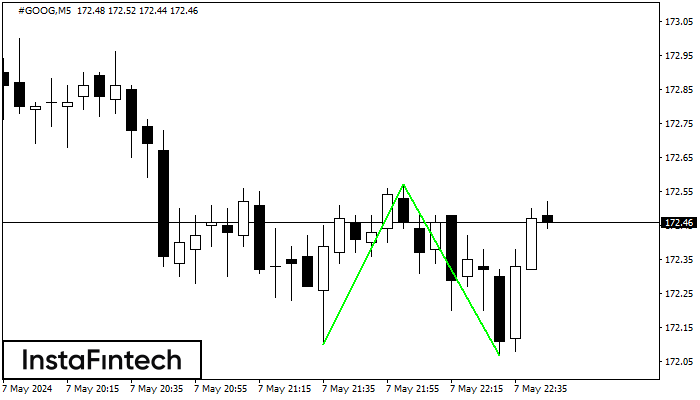
#GOOG M5
Double Top
On the chart of #GOOG M5 the Double Top reversal pattern has been formed. Characteristics: the upper boundary 172.67; the lower boundary 171.43; the width of the pattern 124 points. The signal: a break of the lower boundary will cause continuation of the downward trend targeting the 171.28 level.
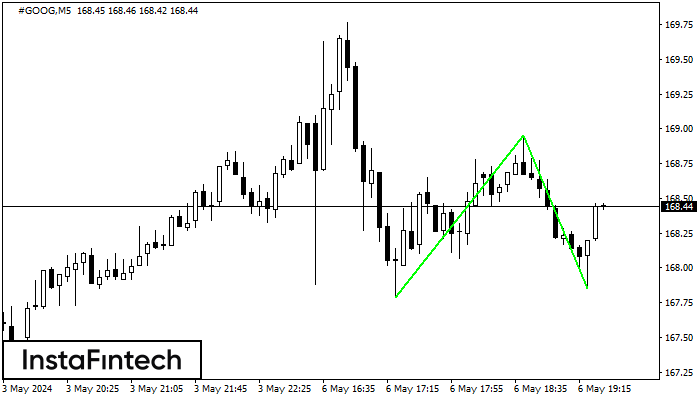
#GOOG M5
Double Bottom
The Double Bottom pattern has been formed on #GOOG M5. Characteristics: the support level 167.79; the resistance level 168.95; the width of the pattern 116 points. If the resistance level is broken, a change in the trend can be predicted with the first target point lying at the distance of 110 points.
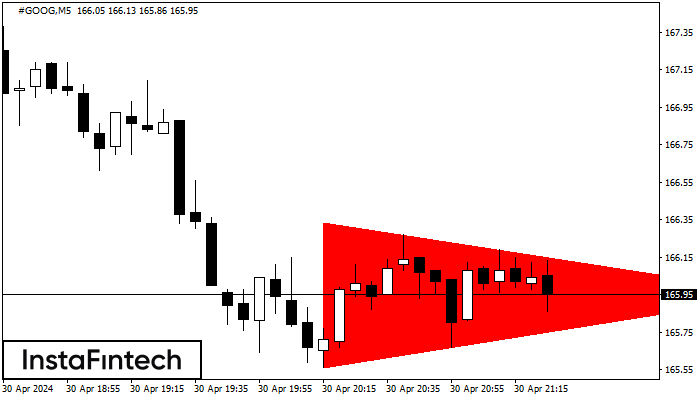
#GOOG M5
Bearish Symmetrical Triangle
According to the chart of M5, #GOOG formed the Bearish Symmetrical Triangle pattern. Trading recommendations: A breach of the lower border 165.56 is likely to encourage a continuation of the downward trend.
#GOOG M5
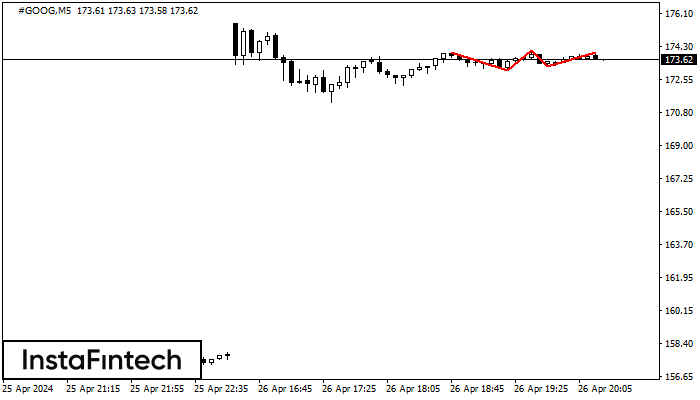
Triple Top
The Triple Top pattern has formed on the chart of the #GOOG M5 trading instrument. It is a reversal pattern featuring the following characteristics: resistance level -2, support level -20, and pattern’s width 96. Forecast If the price breaks through the support level 173.04, it is likely to move further down to 173.95.