 中文
中文  Русский
 English
 Bahasa Indonesia
 Bahasa Malay
 ไทย
ไทย Español
 Deutsch
 Български
 Français
 Tiếng Việt
 বাংলা
বাংলা हिन्दी
 Čeština
 Українська
 Română
FX.co ★ Patterns GBPUSD | British Pound (GBP) to US Dollar (USD) Rate in the Forex market

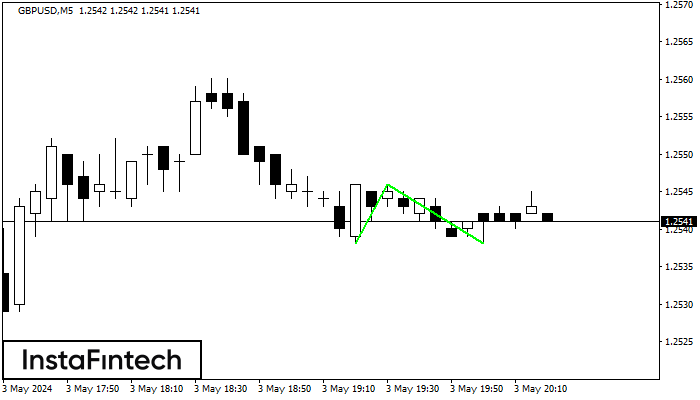
GBPUSD M5
Double Bottom
The Double Bottom pattern has been formed on GBPUSD M5. Characteristics: the support level 1.2538; the resistance level 1.2546; the width of the pattern 8 points. If the resistance level is broken, a change in the trend can be predicted with the first target point lying at the distance of 8 points.
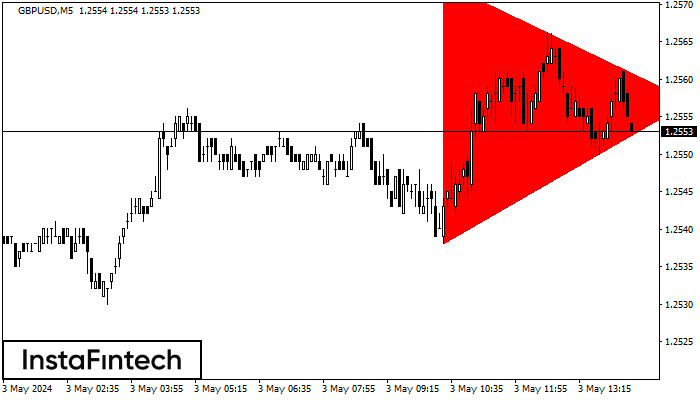
GBPUSD M5
Bearish Symmetrical Triangle
According to the chart of M5, GBPUSD formed the Bearish Symmetrical Triangle pattern. Trading recommendations: A breach of the lower border 1.2538 is likely to encourage a continuation of the downward trend.
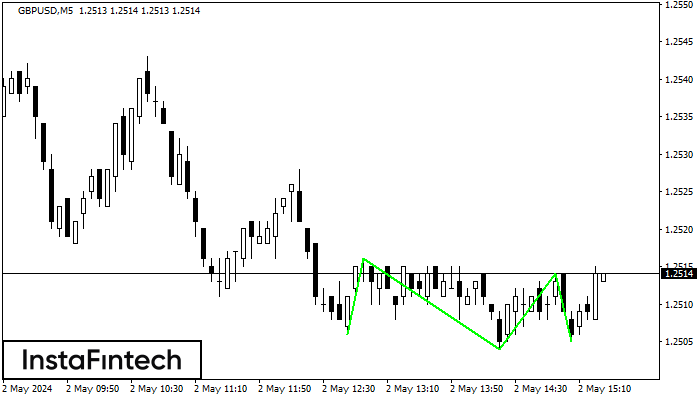
GBPUSD M5
Triple Bottom
The Triple Bottom pattern has been formed on GBPUSD M5. It has the following characteristics: resistance level 1.2516/1.2514; support level 1.2506/1.2505; the width is 10 points. In the event of a breakdown of the resistance level of 1.2516, the price is likely to continue an upward movement at least to 1.2519.
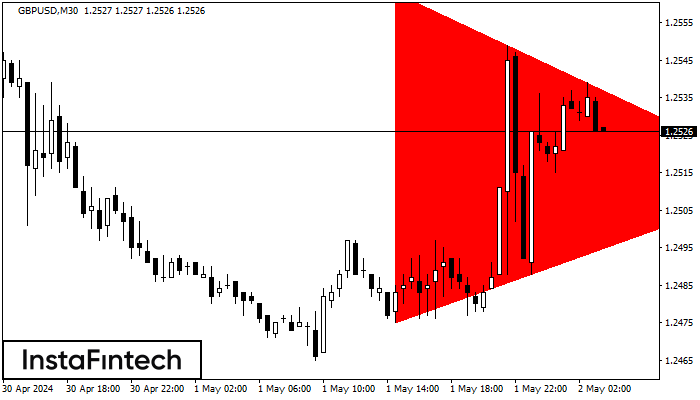
GBPUSD M30
Bearish Symmetrical Triangle
According to the chart of M30, GBPUSD formed the Bearish Symmetrical Triangle pattern. Description: The lower border is 1.2475/1.2513 and upper border is 1.2563/1.2513. The pattern width is measured on the chart at -88 pips. The formation of the Bearish Symmetrical Triangle pattern evidently signals a continuation of the downward trend. In other words, if the scenario comes true and GBPUSD breaches the lower border, the price could continue its move toward 1.2483.
GBPUSD M5
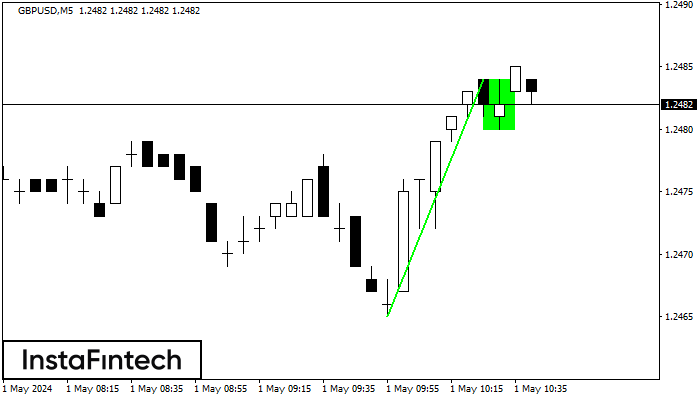
Bullish Flag
The Bullish Flag pattern has been formed on GBPUSD at M5. The lower boundary of the pattern is located at 1.2480/1.2480, while the higher boundary lies at 1.2484/1.2484. The projection of the flagpole is 19 points. This formation signals that the upward trend is most likely to continue. Therefore, if the level of 1.2484 is broken, the price will move further upwards.
GBPUSD M5
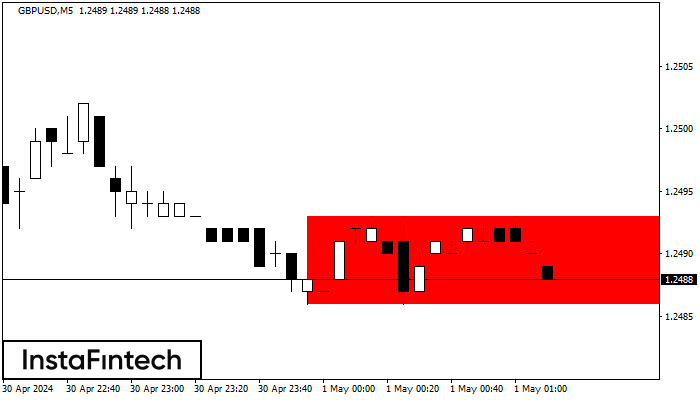
Bearish Rectangle
According to the chart of M5, GBPUSD formed the Bearish Rectangle which is a pattern of a trend continuation. The pattern is contained within the following borders: lower border 1.2486 – 1.2486 and upper border 1.2493 – 1.2493. In case the lower border is broken, the instrument is likely to follow the downward trend.
GBPUSD H1
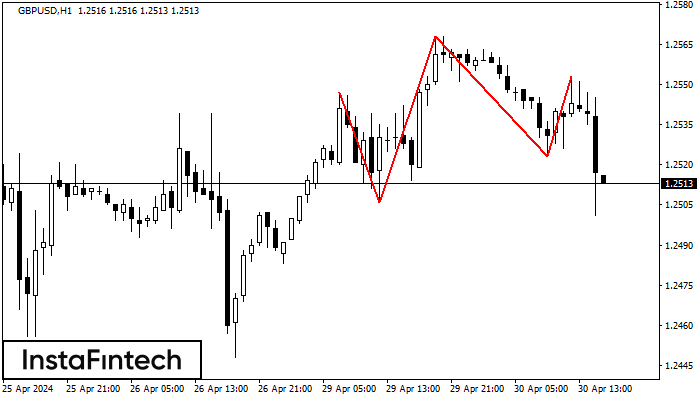
Head and Shoulders
The technical pattern called Head and Shoulders has appeared on the chart of GBPUSD H1. There are weighty reasons to suggest that the price will surpass the Neckline 1.2506/1.2523 after the right shoulder has been formed. So, the trend is set to change with the price heading for 1.2483.
GBPUSD M5
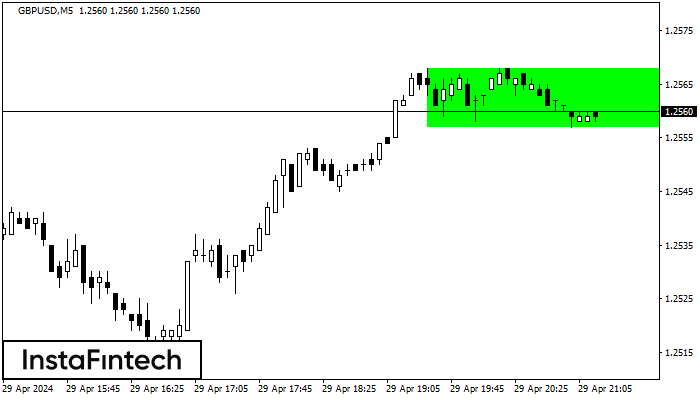
Bullish Rectangle
According to the chart of M5, GBPUSD formed the Bullish Rectangle which is a pattern of a trend continuation. The pattern is contained within the following borders: the lower border 1.2557 – 1.2557 and upper border 1.2568 – 1.2568. In case the upper border is broken, the instrument is likely to follow the upward trend.
GBPUSD M30
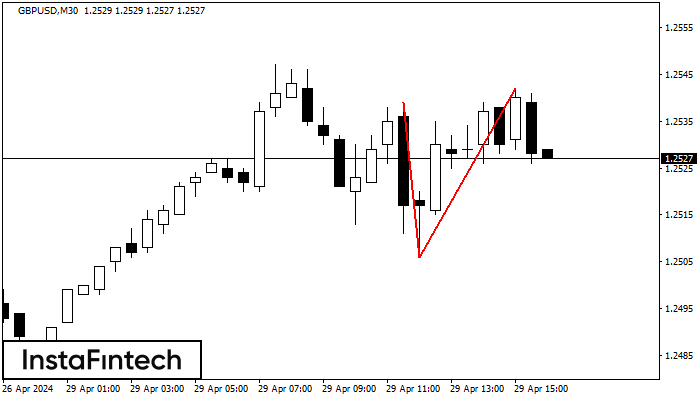
Double Top
The Double Top pattern has been formed on GBPUSD M30. It signals that the trend has been changed from upwards to downwards. Probably, if the base of the pattern 1.2506 is broken, the downward movement will continue.
GBPUSD M15
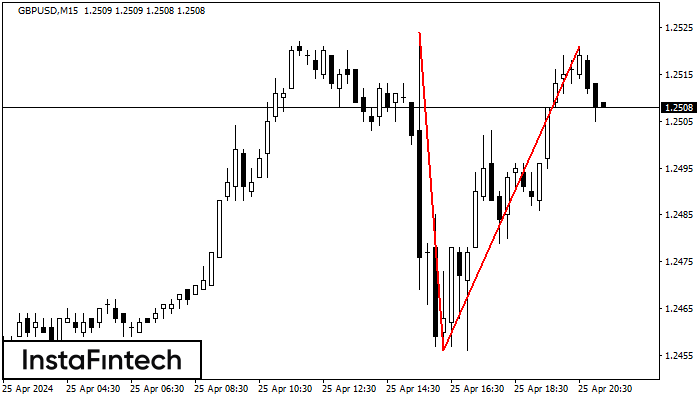
Double Top
The Double Top pattern has been formed on GBPUSD M15. It signals that the trend has been changed from upwards to downwards. Probably, if the base of the pattern 1.2456 is broken, the downward movement will continue.