 中文
中文  Русский
 English
 Bahasa Indonesia
 Bahasa Malay
 ไทย
ไทย Español
 Deutsch
 Български
 Français
 Tiếng Việt
 বাংলা
বাংলা हिन्दी
 Čeština
 Українська
 Română
FX.co ★ Patterns GBPAUD | British Pound (GBP) to Australian Dollar (AUD) Rate in the Forex market

GBPAUD M5
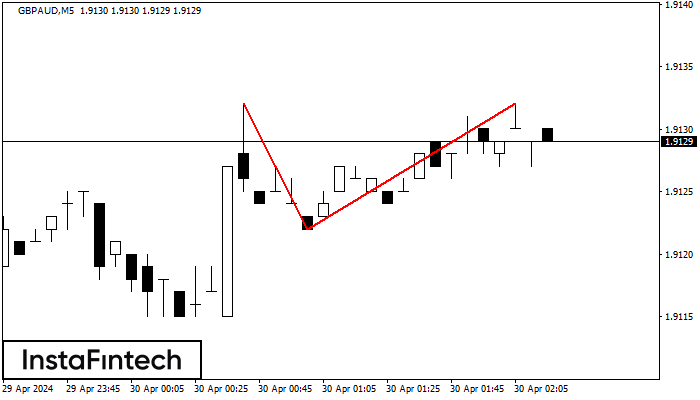
Double Top
On the chart of GBPAUD M5 the Double Top reversal pattern has been formed. Characteristics: the upper boundary 1.9132; the lower boundary 1.9122; the width of the pattern 10 points. The signal: a break of the lower boundary will cause continuation of the downward trend targeting the 1.9107 level.
GBPAUD M5
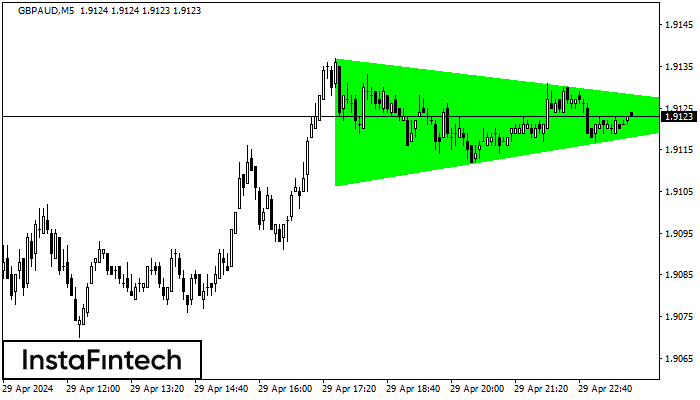
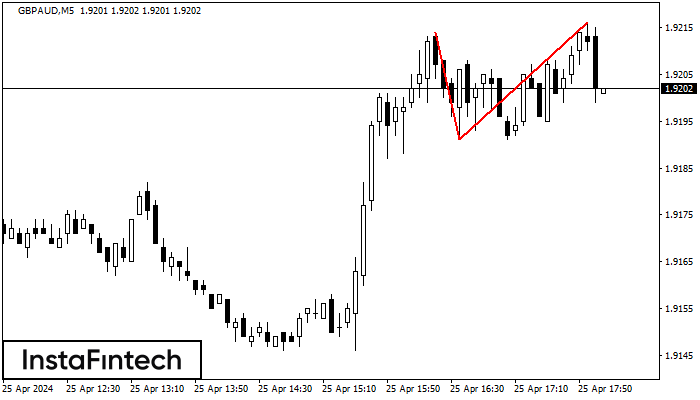
Bullish Symmetrical Triangle
According to the chart of M5, GBPAUD formed the Bullish Symmetrical Triangle pattern, which signals the trend will continue. Description. The upper border of the pattern touches the coordinates 1.9137/1.9124 whereas the lower border goes across 1.9107/1.9124. The pattern width is measured on the chart at 30 pips. If the Bullish Symmetrical Triangle pattern is in progress during the upward trend, this indicates the current trend will go on. In case 1.9124 is broken, the price could continue its move toward 1.9139.
GBPAUD M5
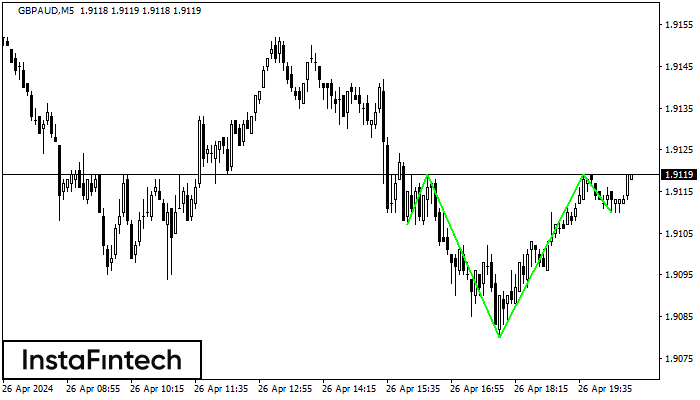
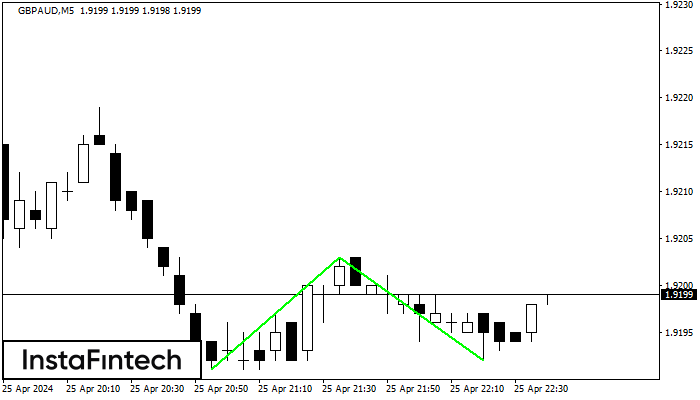
Inverse Head and Shoulder
According to the chart of M5, GBPAUD formed the Inverse Head and Shoulder pattern. The Head’s top is set at 1.9119 while the median line of the Neck is found at 1.9080/1.9110. The formation of the Inverse Head and Shoulder pattern evidently signals a reversal of the downward trend. In other words, in case the scenario comes true, the price of GBPAUD will go towards 1.9134
GBPAUD M5
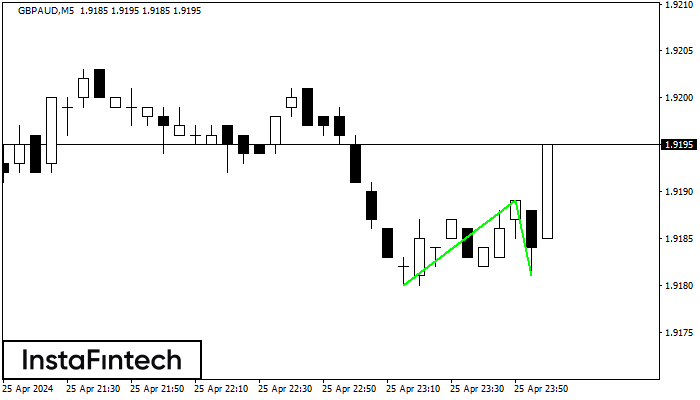
Double Bottom
The Double Bottom pattern has been formed on GBPAUD M5; the upper boundary is 1.9189; the lower boundary is 1.9181. The width of the pattern is 9 points. In case of a break of the upper boundary 1.9189, a change in the trend can be predicted where the width of the pattern will coincide with the distance to a possible take profit level.
GBPAUD M5
Double Bottom
The Double Bottom pattern has been formed on GBPAUD M5. This formation signals a reversal of the trend from downwards to upwards. The signal is that a buy trade should be opened after the upper boundary of the pattern 1.9203 is broken. The further movements will rely on the width of the current pattern 12 points.
GBPAUD M5
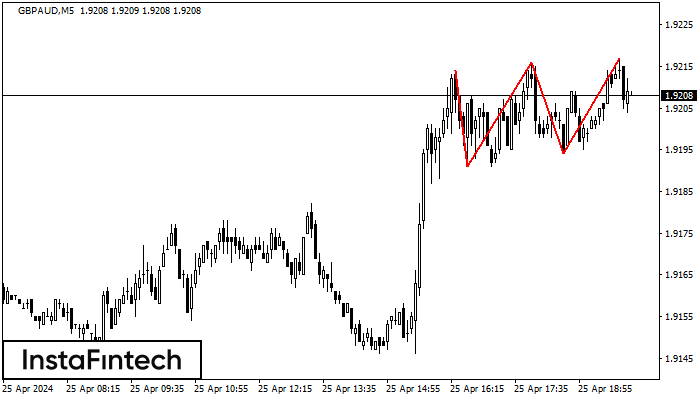
Triple Top
The Triple Top pattern has formed on the chart of the GBPAUD M5. Features of the pattern: borders have an ascending angle; the lower line of the pattern has the coordinates 1.9191/1.9194 with the upper limit 1.9214/1.9217; the projection of the width is 23 points. The formation of the Triple Top figure most likely indicates a change in the trend from upward to downward. This means that in the event of a breakdown of the support level of 1.9191, the price is most likely to continue the downward movement.
GBPAUD M5
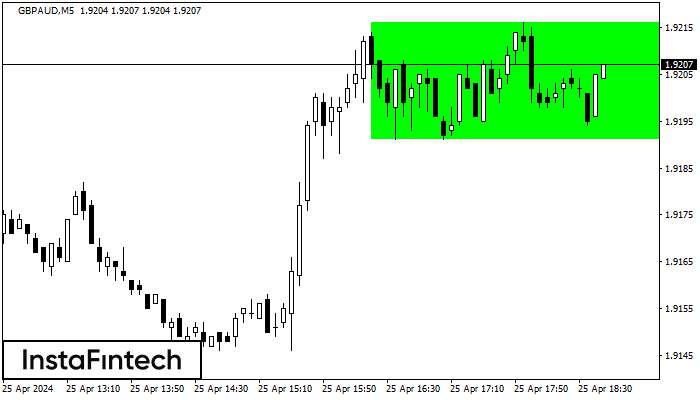
Bullish Rectangle
According to the chart of M5, GBPAUD formed the Bullish Rectangle. The pattern indicates a trend continuation. The upper border is 1.9216, the lower border is 1.9191. The signal means that a long position should be opened above the upper border 1.9216 of the Bullish Rectangle.
GBPAUD M5
Double Top
The Double Top reversal pattern has been formed on GBPAUD M5. Characteristics: the upper boundary 1.9214; the lower boundary 1.9191; the width of the pattern is 25 points. Sell trades are better to be opened below the lower boundary 1.9191 with a possible movements towards the 1.9176 level.
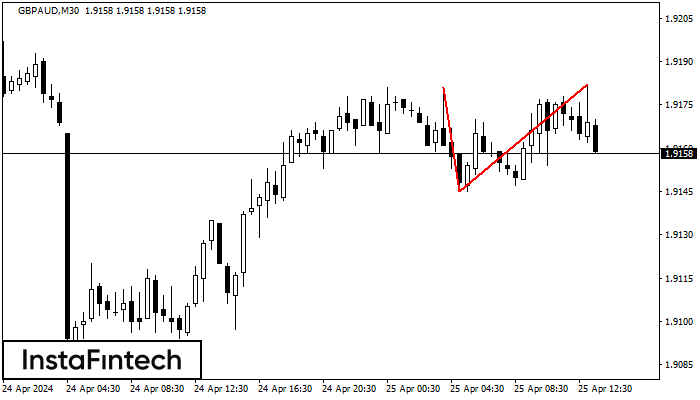
GBPAUD M30
Double Top
On the chart of GBPAUD M30 the Double Top reversal pattern has been formed. Characteristics: the upper boundary 1.9182; the lower boundary 1.9145; the width of the pattern 37 points. The signal: a break of the lower boundary will cause continuation of the downward trend targeting the 1.9115 level.
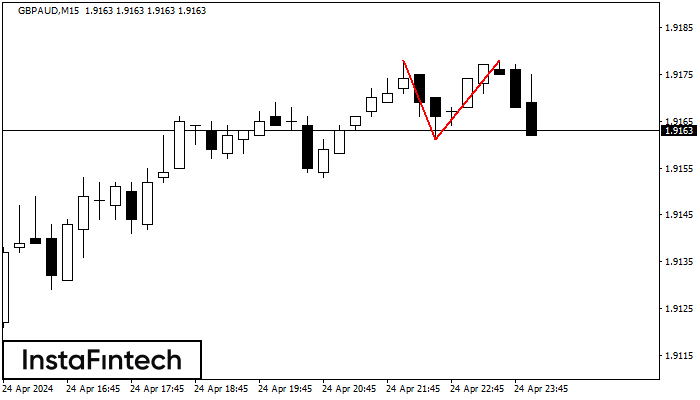
GBPAUD M15
Double Top
The Double Top reversal pattern has been formed on GBPAUD M15. Characteristics: the upper boundary 1.9178; the lower boundary 1.9161; the width of the pattern is 17 points. Sell trades are better to be opened below the lower boundary 1.9161 with a possible movements towards the 1.9138 level.