 中文
中文  Русский
 English
 Bahasa Indonesia
 Bahasa Malay
 ไทย
ไทย Español
 Deutsch
 Български
 Français
 Tiếng Việt
 বাংলা
বাংলা हिन्दी
 Čeština
 Українська
 Română
FX.co ★ Patterns EURUSD | Euro (EUR) to US Dollar (USD) Rate in the Forex market

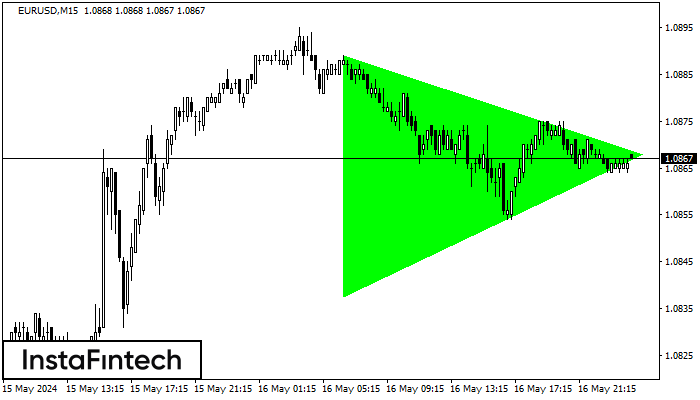
EURUSD M15
Bullish Symmetrical Triangle
According to the chart of M15, EURUSD formed the Bullish Symmetrical Triangle pattern, which signals the trend will continue. Description. The upper border of the pattern touches the coordinates 1.0889/1.0868 whereas the lower border goes across 1.0838/1.0868. The pattern width is measured on the chart at 51 pips. If the Bullish Symmetrical Triangle pattern is in progress during the upward trend, this indicates the current trend will go on. In case 1.0868 is broken, the price could continue its move toward 1.0891.
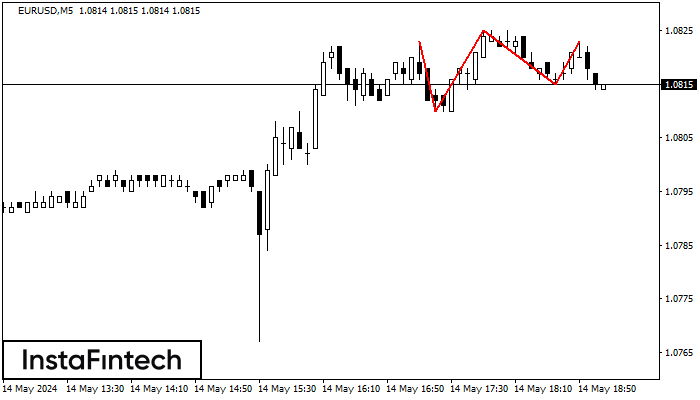
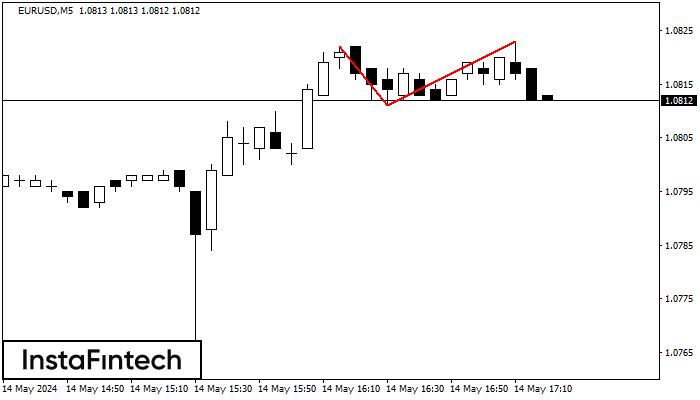
EURUSD M5
Triple Top
On the chart of the EURUSD M5 trading instrument, the Triple Top pattern that signals a trend change has formed. It is possible that after formation of the third peak, the price will try to break through the resistance level 1.0810, where we advise to open a trading position for sale. Take profit is the projection of the pattern’s width, which is 13 points.
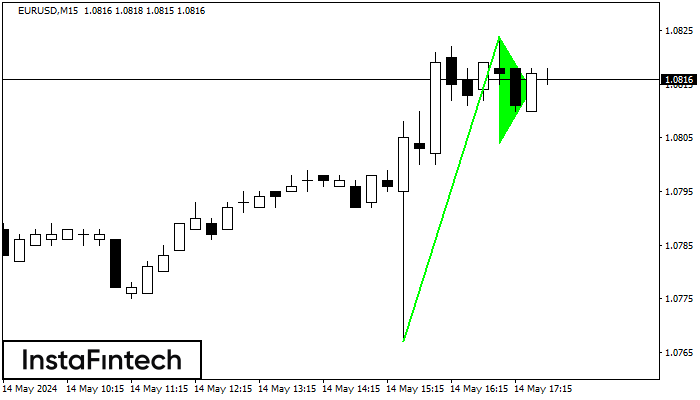
EURUSD M15
Bullish Flag
The Bullish Flag pattern has been formed on EURUSD at M15. The lower boundary of the pattern is located at 1.0810/1.0798, while the higher boundary lies at 1.0824/1.0812. The projection of the flagpole is 57 points. This formation signals that the upward trend is most likely to continue. Therefore, if the level of 1.0824 is broken, the price will move further upwards.
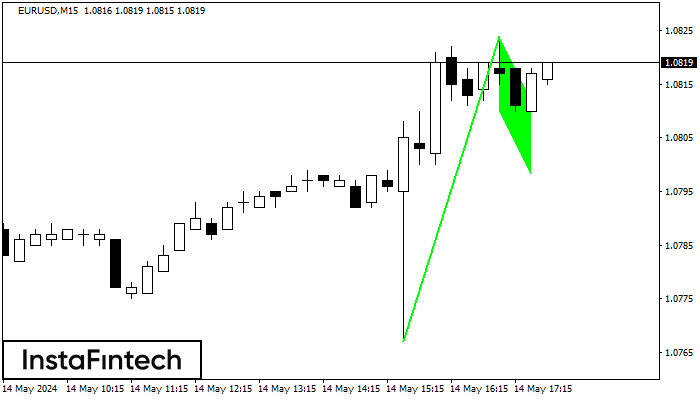
EURUSD M15
Bullish pennant
The Bullish pennant pattern is formed on the EURUSD M15 chart. It is a type of the continuation pattern. Supposedly, in case the price is fixed above the pennant’s high of 1.0824, a further uptrend is possible.
EURUSD M5
Double Top
The Double Top reversal pattern has been formed on EURUSD M5. Characteristics: the upper boundary 1.0822; the lower boundary 1.0811; the width of the pattern is 12 points. Sell trades are better to be opened below the lower boundary 1.0811 with a possible movements towards the 1.0796 level.
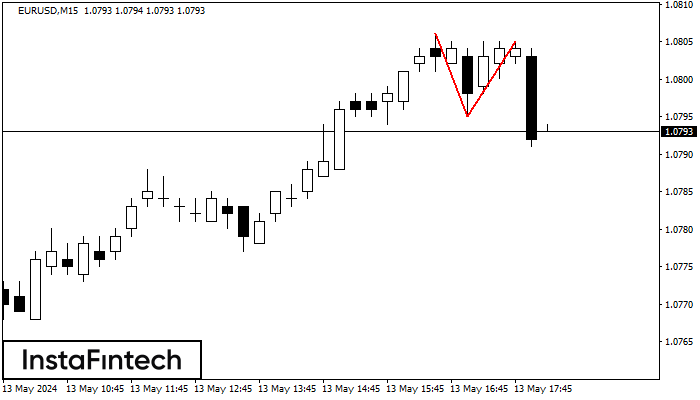
EURUSD M15
Double Top
The Double Top pattern has been formed on EURUSD M15. It signals that the trend has been changed from upwards to downwards. Probably, if the base of the pattern 1.0795 is broken, the downward movement will continue.
EURUSD M5
Double Top
On the chart of EURUSD M5 the Double Top reversal pattern has been formed. Characteristics: the upper boundary 1.0786; the lower boundary 1.0779; the width of the pattern 7 points. The signal: a break of the lower boundary will cause continuation of the downward trend targeting the 1.0764 level.
EURUSD M15
Triple Top
The Triple Top pattern has formed on the chart of the EURUSD M15 trading instrument. It is a reversal pattern featuring the following characteristics: resistance level -3, support level -6, and pattern’s width 12. Forecast If the price breaks through the support level 1.0769, it is likely to move further down to 1.0757.
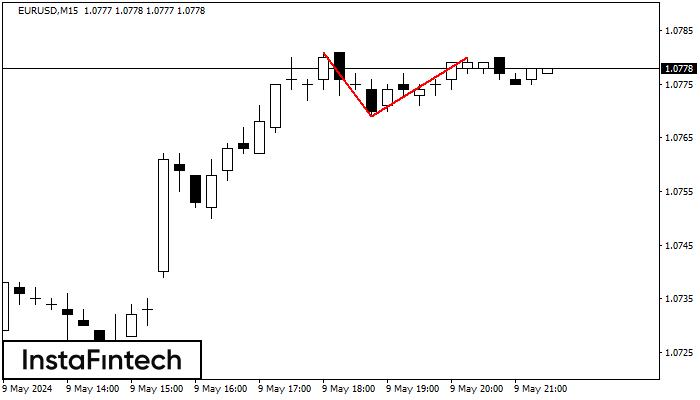
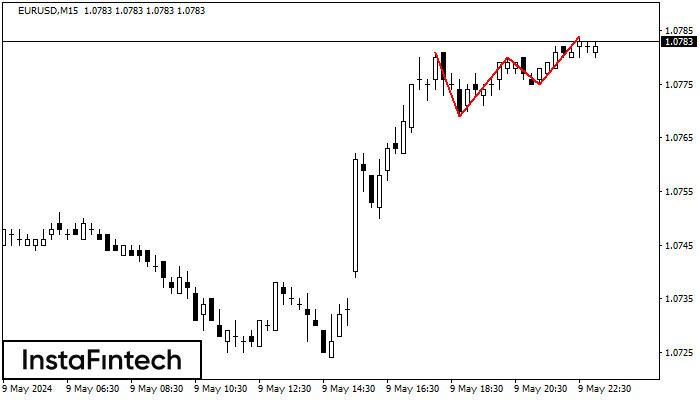
EURUSD M15
Double Top
The Double Top pattern has been formed on EURUSD M15. It signals that the trend has been changed from upwards to downwards. Probably, if the base of the pattern 1.0769 is broken, the downward movement will continue.
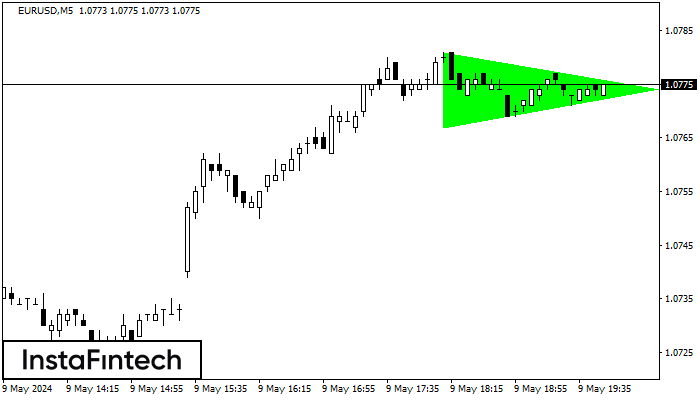
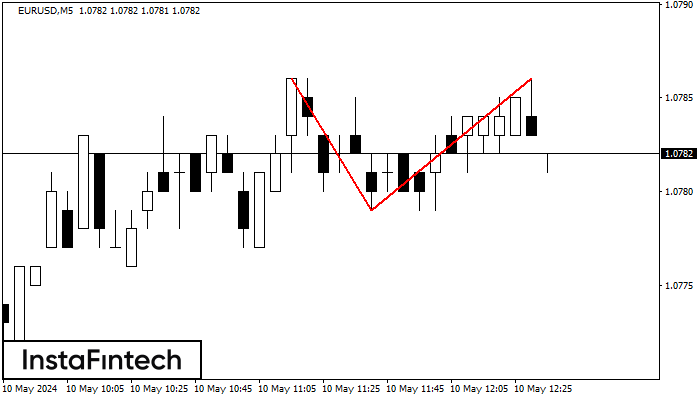
EURUSD M5
Bullish Symmetrical Triangle
According to the chart of M5, EURUSD formed the Bullish Symmetrical Triangle pattern. The lower border of the pattern touches the coordinates 1.0767/1.0774 whereas the upper border goes across 1.0781/1.0774. If the Bullish Symmetrical Triangle pattern is in progress, this evidently signals a further upward trend. In other words, in case the scenario comes true, the price of EURUSD will breach the upper border to head for 1.0789.