 中文
中文  Русский
 English
 Bahasa Indonesia
 Bahasa Malay
 ไทย
ไทย Español
 Deutsch
 Български
 Français
 Tiếng Việt
 বাংলা
বাংলা हिन्दी
 Čeština
 Українська
 Română
FX.co ★ Patterns EURJPY | Euro (EUR) to Japanese Yen (JPY) Rate in the Forex market

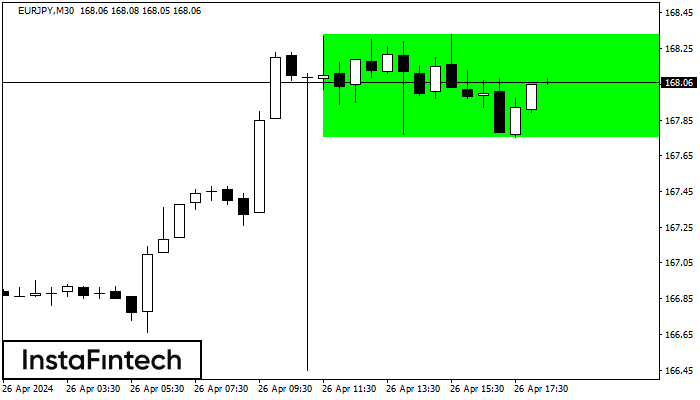
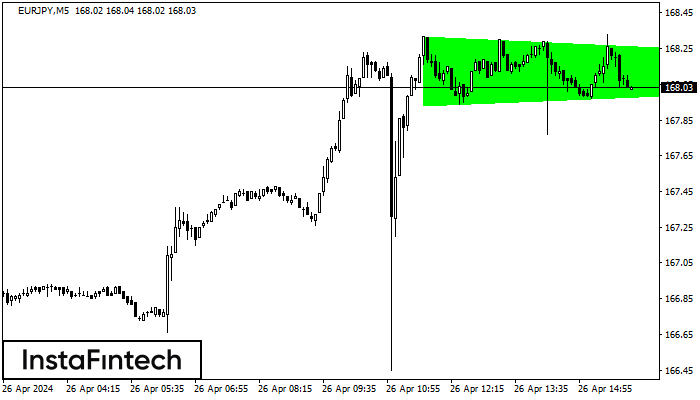
EURJPY M30
Bullish Rectangle
According to the chart of M30, EURJPY formed the Bullish Rectangle. The pattern indicates a trend continuation. The upper border is 168.33, the lower border is 167.75. The signal means that a long position should be opened above the upper border 168.33 of the Bullish Rectangle.
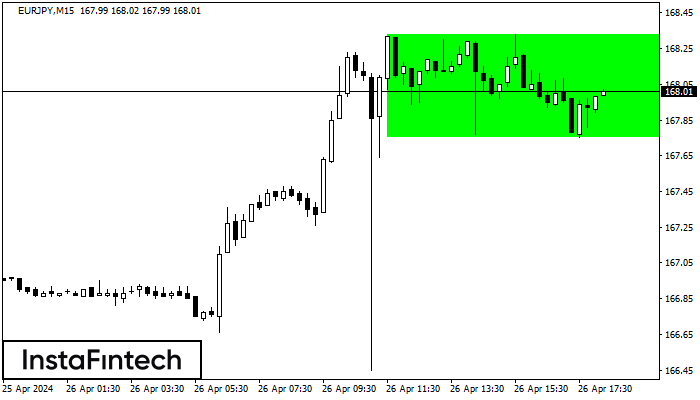
EURJPY M15
Bullish Rectangle
According to the chart of M15, EURJPY formed the Bullish Rectangle which is a pattern of a trend continuation. The pattern is contained within the following borders: the lower border 167.75 – 167.75 and upper border 168.33 – 168.33. In case the upper border is broken, the instrument is likely to follow the upward trend.
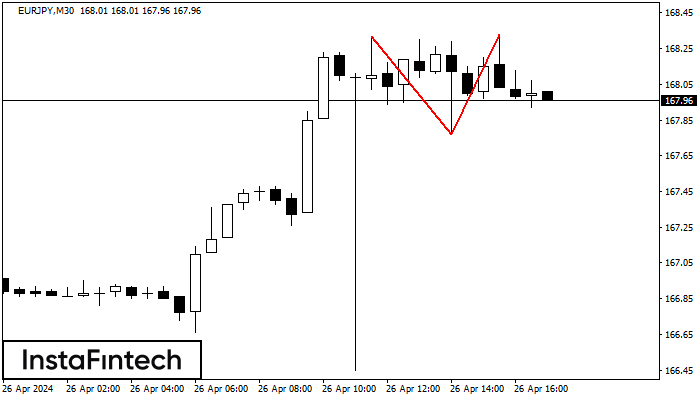
EURJPY M30
Double Top
The Double Top pattern has been formed on EURJPY M30. It signals that the trend has been changed from upwards to downwards. Probably, if the base of the pattern 167.77 is broken, the downward movement will continue.
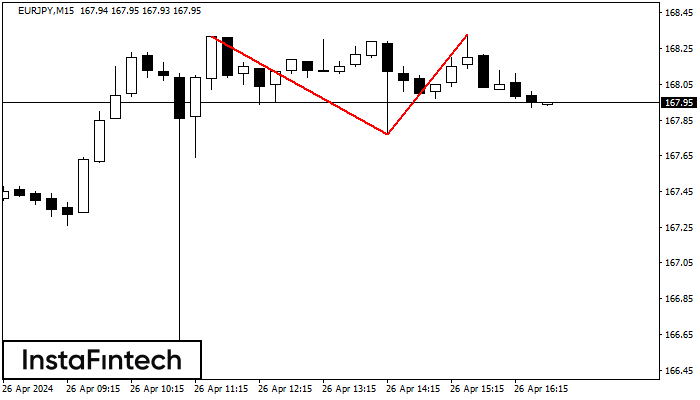
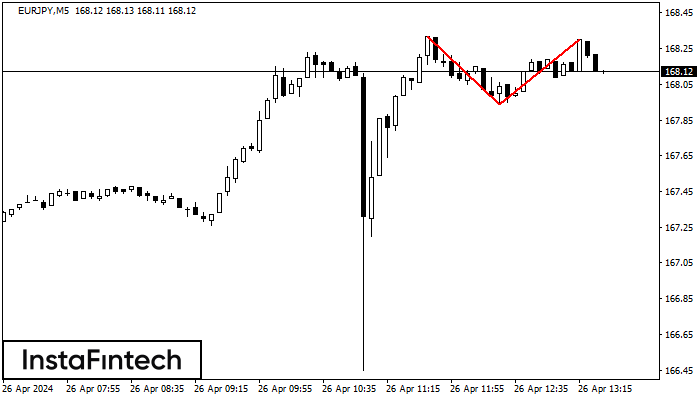
EURJPY M15
Double Top
The Double Top pattern has been formed on EURJPY M15. It signals that the trend has been changed from upwards to downwards. Probably, if the base of the pattern 167.77 is broken, the downward movement will continue.
EURJPY M5
Bullish Symmetrical Triangle
According to the chart of M5, EURJPY formed the Bullish Symmetrical Triangle pattern. The lower border of the pattern touches the coordinates 167.93/168.11 whereas the upper border goes across 168.32/168.11. If the Bullish Symmetrical Triangle pattern is in progress, this evidently signals a further upward trend. In other words, in case the scenario comes true, the price of EURJPY will breach the upper border to head for 168.26.
EURJPY M5
Double Top
The Double Top pattern has been formed on EURJPY M5. It signals that the trend has been changed from upwards to downwards. Probably, if the base of the pattern 167.94 is broken, the downward movement will continue.
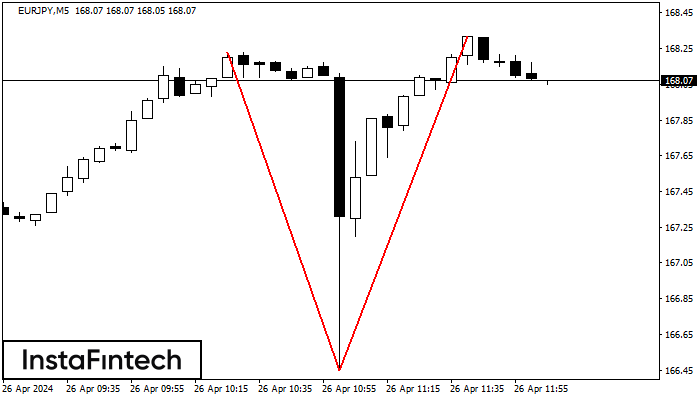
EURJPY M5
Double Top
On the chart of EURJPY M5 the Double Top reversal pattern has been formed. Characteristics: the upper boundary 168.32; the lower boundary 166.45; the width of the pattern 187 points. The signal: a break of the lower boundary will cause continuation of the downward trend targeting the 166.30 level.
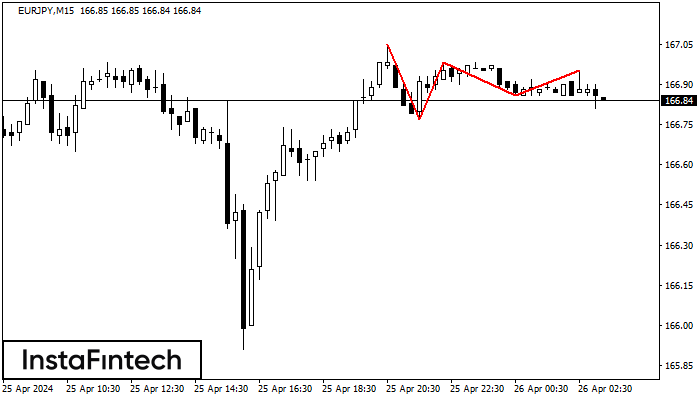
EURJPY M15
Triple Top
The Triple Top pattern has formed on the chart of the EURJPY M15. Features of the pattern: borders have an ascending angle; the lower line of the pattern has the coordinates 166.77/166.86 with the upper limit 167.05/166.95; the projection of the width is 28 points. The formation of the Triple Top figure most likely indicates a change in the trend from upward to downward. This means that in the event of a breakdown of the support level of 166.77, the price is most likely to continue the downward movement.
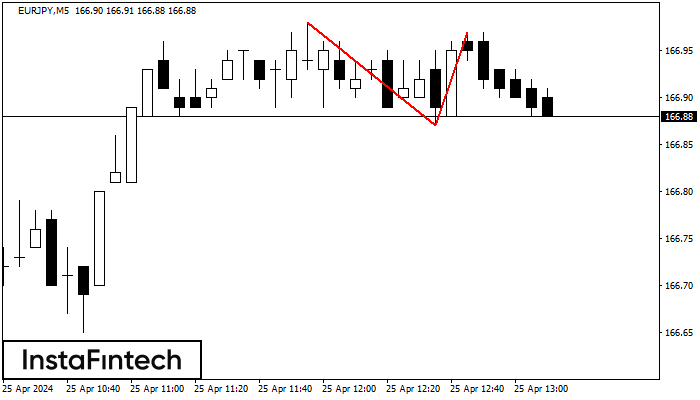
EURJPY M5
Double Top
On the chart of EURJPY M5 the Double Top reversal pattern has been formed. Characteristics: the upper boundary 166.73; the lower boundary 166.54; the width of the pattern 19 points. The signal: a break of the lower boundary will cause continuation of the downward trend targeting the 166.39 level.
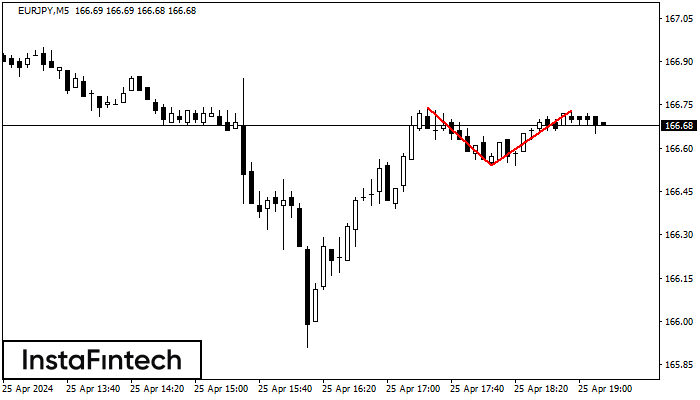
EURJPY M5
Double Top
The Double Top pattern has been formed on EURJPY M5. It signals that the trend has been changed from upwards to downwards. Probably, if the base of the pattern 166.87 is broken, the downward movement will continue.