 中文
中文  Русский
 English
 Bahasa Indonesia
 Bahasa Malay
 ไทย
ไทย Español
 Deutsch
 Български
 Français
 Tiếng Việt
 বাংলা
বাংলা हिन्दी
 Čeština
 Українська
 Română
FX.co ★ Patterns AUDJPY | Australian Dollar (AUD) to Japanese Yen (JPY) Rate in the Forex market

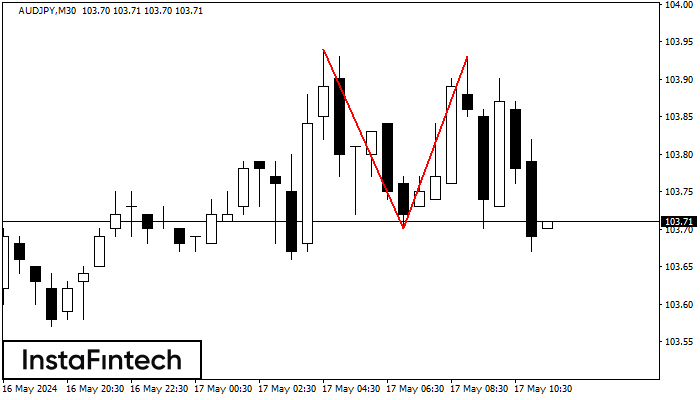
AUDJPY M30
Double Top
On the chart of AUDJPY M30 the Double Top reversal pattern has been formed. Characteristics: the upper boundary 103.93; the lower boundary 103.70; the width of the pattern 23 points. The signal: a break of the lower boundary will cause continuation of the downward trend targeting the 103.40 level.
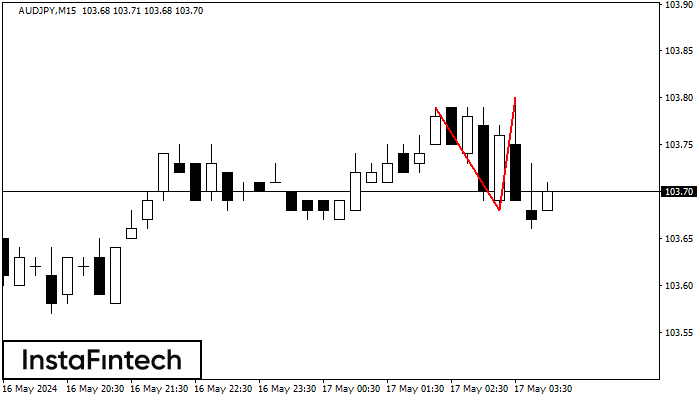
AUDJPY M15
Double Top
The Double Top pattern has been formed on AUDJPY M15. It signals that the trend has been changed from upwards to downwards. Probably, if the base of the pattern 103.68 is broken, the downward movement will continue.
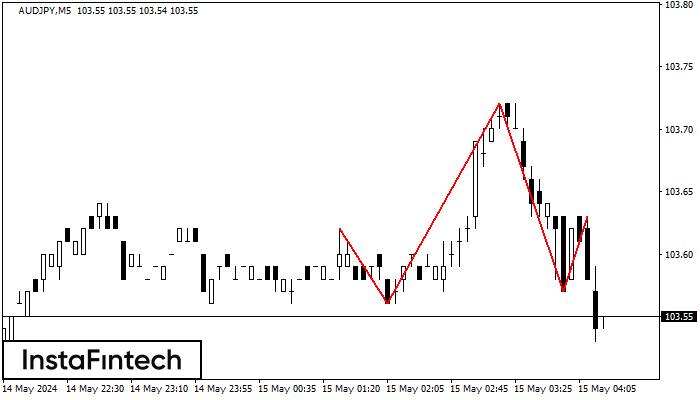
AUDJPY M5
Head and Shoulders
The technical pattern called Head and Shoulders has appeared on the chart of AUDJPY M5. There are weighty reasons to suggest that the price will surpass the Neckline 103.56/103.57 after the right shoulder has been formed. So, the trend is set to change with the price heading for 103.42.
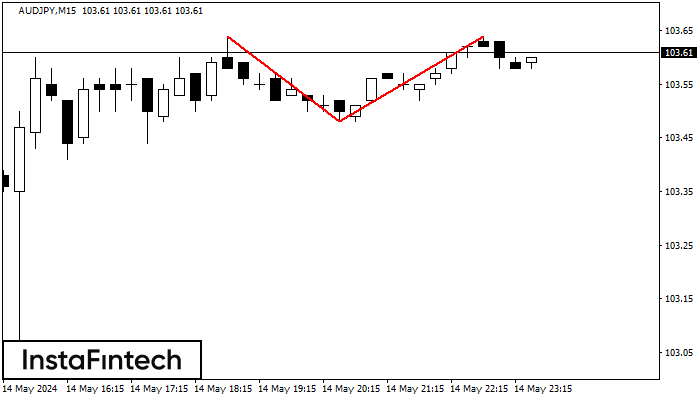
AUDJPY M15
Double Top
On the chart of AUDJPY M15 the Double Top reversal pattern has been formed. Characteristics: the upper boundary 103.64; the lower boundary 103.48; the width of the pattern 16 points. The signal: a break of the lower boundary will cause continuation of the downward trend targeting the 103.25 level.
AUDJPY M5
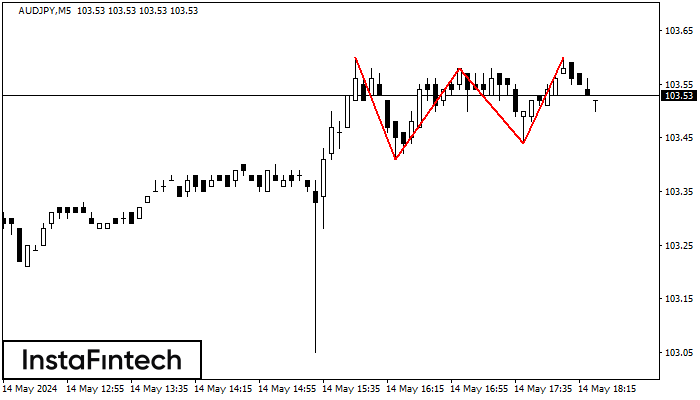
Triple Top
On the chart of the AUDJPY M5 trading instrument, the Triple Top pattern that signals a trend change has formed. It is possible that after formation of the third peak, the price will try to break through the resistance level 103.41, where we advise to open a trading position for sale. Take profit is the projection of the pattern’s width, which is 19 points.
AUDJPY M5
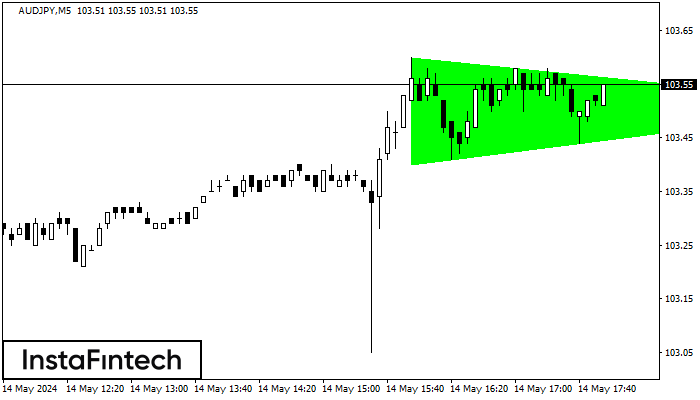
Bullish Symmetrical Triangle
According to the chart of M5, AUDJPY formed the Bullish Symmetrical Triangle pattern, which signals the trend will continue. Description. The upper border of the pattern touches the coordinates 103.60/103.51 whereas the lower border goes across 103.40/103.51. The pattern width is measured on the chart at 20 pips. If the Bullish Symmetrical Triangle pattern is in progress during the upward trend, this indicates the current trend will go on. In case 103.51 is broken, the price could continue its move toward 103.66.
AUDJPY M5
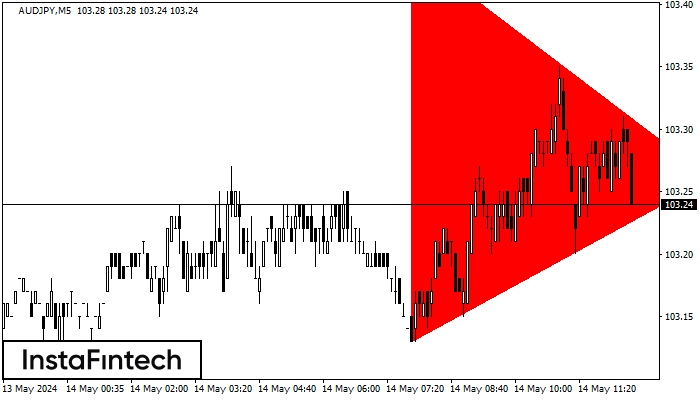
Bearish Symmetrical Triangle
According to the chart of M5, AUDJPY formed the Bearish Symmetrical Triangle pattern. Trading recommendations: A breach of the lower border 103.13 is likely to encourage a continuation of the downward trend.
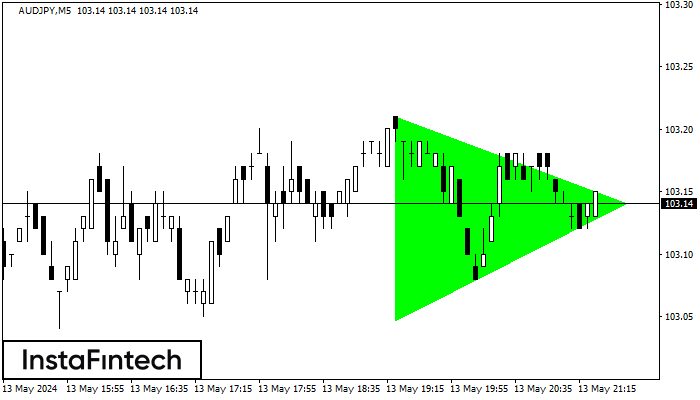
AUDJPY M5
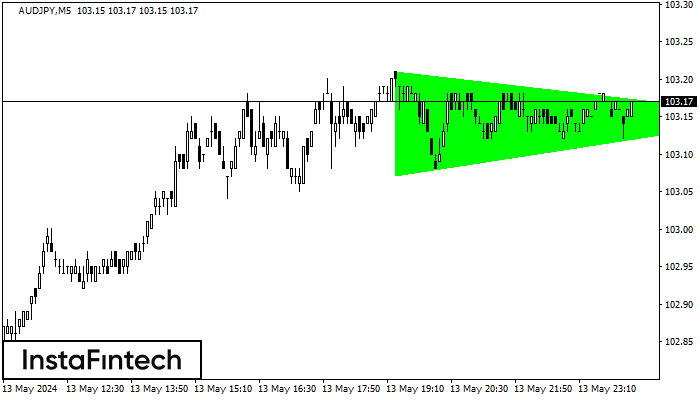
Bullish Symmetrical Triangle
According to the chart of M5, AUDJPY formed the Bullish Symmetrical Triangle pattern, which signals the trend will continue. Description. The upper border of the pattern touches the coordinates 103.21/103.15 whereas the lower border goes across 103.07/103.15. The pattern width is measured on the chart at 14 pips. If the Bullish Symmetrical Triangle pattern is in progress during the upward trend, this indicates the current trend will go on. In case 103.15 is broken, the price could continue its move toward 103.30.
AUDJPY M5
Bullish Symmetrical Triangle
According to the chart of M5, AUDJPY formed the Bullish Symmetrical Triangle pattern. Description: This is the pattern of a trend continuation. 103.21 and 103.05 are the coordinates of the upper and lower borders respectively. The pattern width is measured on the chart at 16 pips. Outlook: If the upper border 103.21 is broken, the price is likely to continue its move by 103.29.
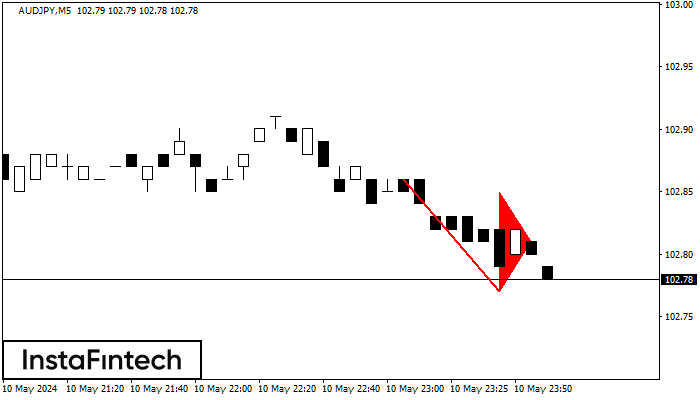
AUDJPY M5
Bearish pennant
The Bearish pennant pattern has formed on the AUDJPY M5 chart. The pattern signals continuation of the downtrend in case the pennant’s low of 102.77 is broken through. Recommendations: Place the sell stop pending order 10 pips below the pattern’s low. Place the take profit order at the projection distance of the flagpole height.