 中文
中文  Русский
 English
 Bahasa Indonesia
 Bahasa Malay
 ไทย
ไทย Español
 Deutsch
 Български
 Français
 Tiếng Việt
 বাংলা
বাংলা हिन्दी
 Čeština
 Українська
 Română
FX.co ★ Actual patterns. Technical analysis and trading recommendations

技术分析模式
There is nothing more precious to a trader than an ability to predict a further price movement. Technical analysis is a key to your successful transaction. At the same time, you can rely on common and recurring situations that arise in the same circumstances. Our Technical Analysis Patterns section features all trading recommendations based on the technical analysis patterns that help traders make projections and turn a profit.
Instrument:
所有
#Bitcoin
EURCHF
EURGBP
EURJPY
EURUSD
EURCAD
EURRUB
EURNZD
USDCAD
USDCHF
USDJPY
USDRUB
NZDCAD
NZDUSD
NZDCHF
NZDJPY
AUDCAD
AUDCHF
AUDJPY
AUDUSD
GBPUSD
GBPJPY
GBPAUD
GBPCHF
GOLD
SILVER
#AAPL
#AMZN
#EBAY
#FB
#GOOG
#MCD
#MA
#KO
#INTC
#MSFT
#NTDOY
#PEP
#TSLA
#TWTR
Figure:
所有
Triangle
Rectangle
Pennant
Flag
Head and Shoulders
Double Top
Triple top
Timeframe:
所有
M5
M15
M30
H1
D1
Signal strength:
所有
High
Medium
Low
Signal direction:
所有
Buy
Sell
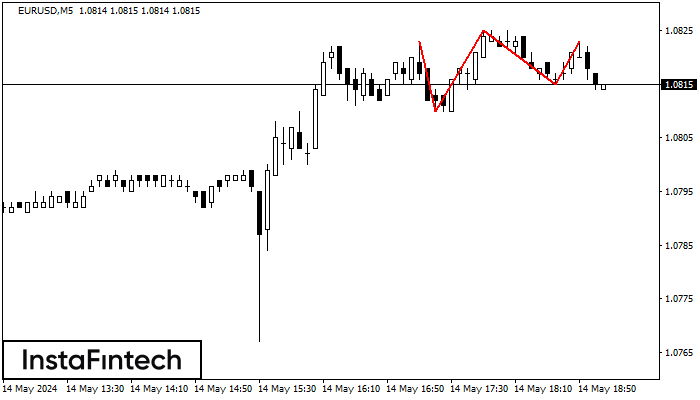
EURUSD M5
Triple Top
On the chart of the EURUSD M5 trading instrument, the Triple Top pattern that signals a trend change has formed. It is possible that after formation of the third peak, the price will try to break through the resistance level 1.0810, where we advise to open a trading position for sale. Take profit is the projection of the pattern’s width, which is 13 points.
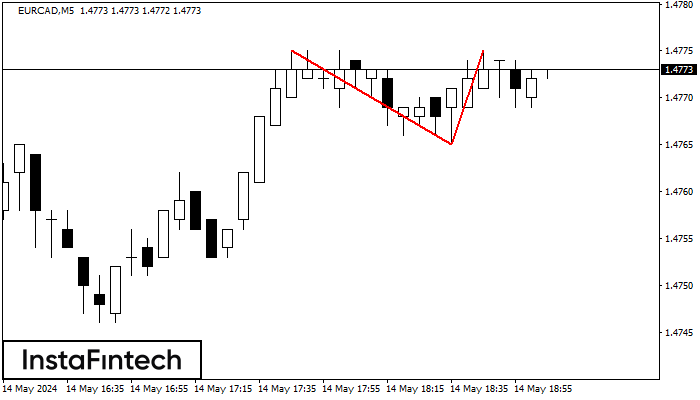
EURCAD M5
Double Top
The Double Top reversal pattern has been formed on EURCAD M5. Characteristics: the upper boundary 1.4775; the lower boundary 1.4765; the width of the pattern is 10 points. Sell trades are better to be opened below the lower boundary 1.4765 with a possible movements towards the 1.4750 level.
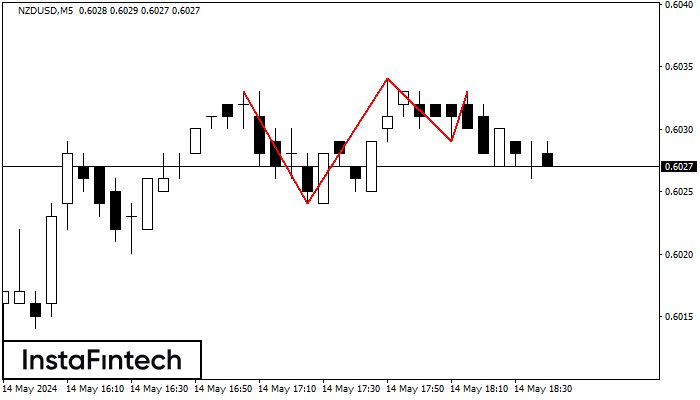
NZDUSD M5
Triple Top
On the chart of the NZDUSD M5 trading instrument, the Triple Top pattern that signals a trend change has formed. It is possible that after formation of the third peak, the price will try to break through the resistance level 0.6024, where we advise to open a trading position for sale. Take profit is the projection of the pattern’s width, which is 9 points.
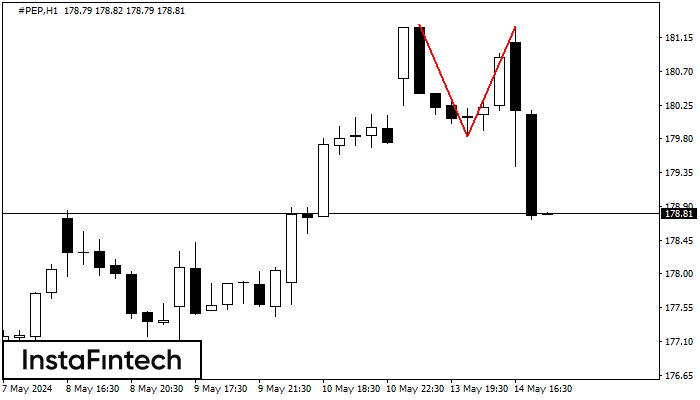
#PEP H1
Double Top
The Double Top pattern has been formed on #PEP H1. It signals that the trend has been changed from upwards to downwards. Probably, if the base of the pattern 179.83 is broken, the downward movement will continue.
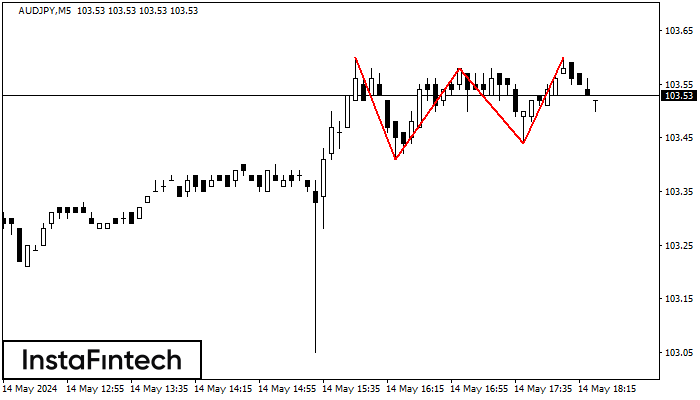
AUDJPY M5
Triple Top
On the chart of the AUDJPY M5 trading instrument, the Triple Top pattern that signals a trend change has formed. It is possible that after formation of the third peak, the price will try to break through the resistance level 103.41, where we advise to open a trading position for sale. Take profit is the projection of the pattern’s width, which is 19 points.
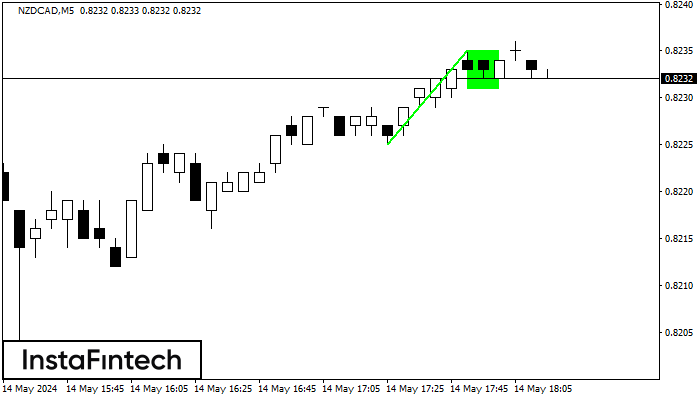
NZDCAD M5
Bullish Flag
The Bullish Flag pattern which signals continuation of a trend has been formed on the chart NZDCAD M5. Forecast: if the price breaks above the pattern high at 0.8235, then traders will be able to place a long deal with the target at 0.8250.
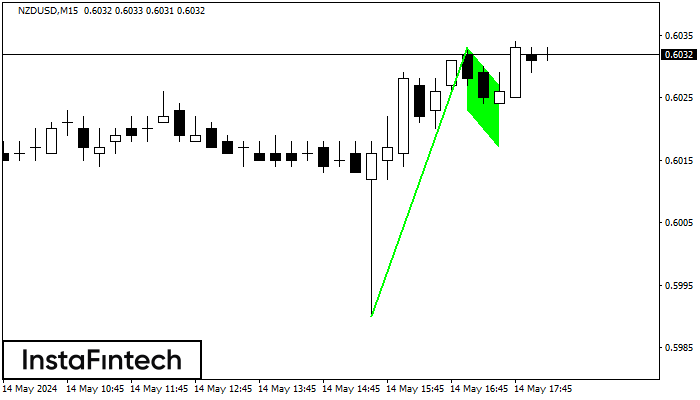
NZDUSD M15
Bullish Flag
The Bullish Flag pattern has been formed on NZDUSD at M15. The lower boundary of the pattern is located at 0.6023/0.6017, while the higher boundary lies at 0.6033/0.6027. The projection of the flagpole is 43 points. This formation signals that the upward trend is most likely to continue. Therefore, if the level of 0.6033 is broken, the price will move further upwards.
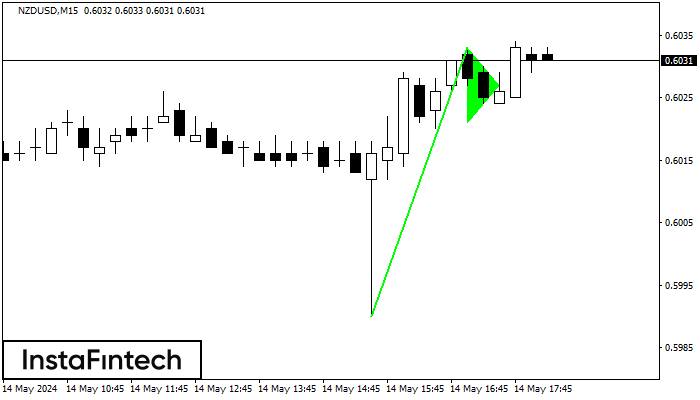
NZDUSD M15
Bullish pennant
The Bullish pennant graphic pattern has formed on the NZDUSD M15 instrument. This pattern type falls under the category of continuation patterns. In this case, if the quote can breaks out high, is expected to continue the upward trend to level 0.6055.
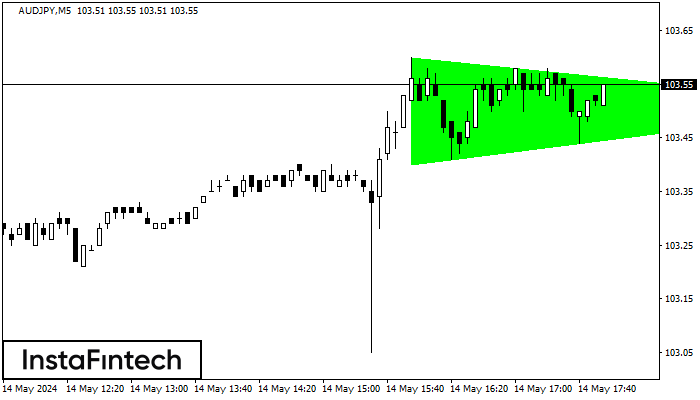
AUDJPY M5
Bullish Symmetrical Triangle
According to the chart of M5, AUDJPY formed the Bullish Symmetrical Triangle pattern, which signals the trend will continue. Description. The upper border of the pattern touches the coordinates 103.60/103.51 whereas the lower border goes across 103.40/103.51. The pattern width is measured on the chart at 20 pips. If the Bullish Symmetrical Triangle pattern is in progress during the upward trend, this indicates the current trend will go on. In case 103.51 is broken, the price could continue its move toward 103.66.
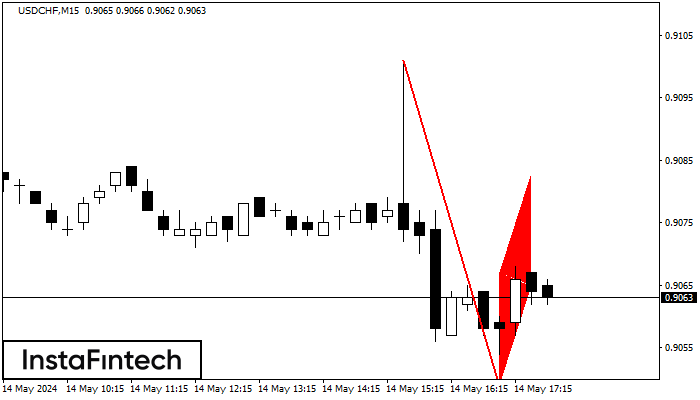
USDCHF M15
Bearish Flag
The Bearish Flag pattern has been formed on the chart USDCHF M15 which signals that the downward trend will continue. If the price breaks below the low at 0.9049, then it is most likely to move further downwards. The price will likely move by the number of points which equals the length of the flag pole (15 points).