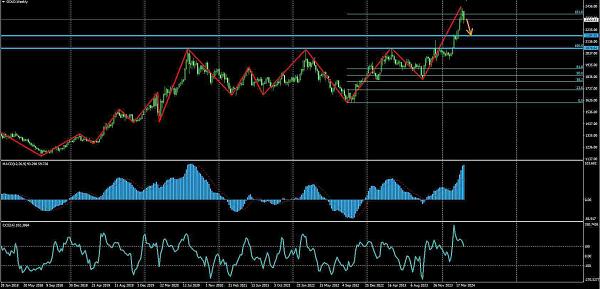
Another trading week has ended, and once again, I suggest focusing on the weekly chart of the XAUUSD instrument. The first thing that catches the eye is that the price is hovering near the historical maximum for the entire trading history available on the terminal. The wave structure is clearly building its upward sequence, and the MACD indicator is in the overbought zone, above its signal line. By applying the Fibonacci target grid to the first wave from the bottom, it can be seen that the price has reached the 161.8 level and a struggle has ensued. Positions from longs are being closed en masse, shorts are being opened, and last week even formed a pin bar or inverted hammer - a candlestick pattern characteristic of an upcoming reversal. Attempts were made to push the price even higher, but failed, and this week the bears have started to gradually dominate, leading to some decline. The CCI indicator is ready to cross the upper overbought boundary from top to bottom, exit the zone downwards, increasing the likelihood of downward pressure. I assume that in the future, the price will eventually drop to the nearest significant horizontal support level at 2184. The second target, with a lower probability of being reached, will be the main level at 2078. In my opinion, it is more promising to work downwards on smaller timeframes, at least until the first target. Of course, with stops and small volume, as the trend is very strong and may push the price of gold further up to unknown values against all indicators. After all, this is gold, not a currency pair; it loves to grow with such prolonged movements that it can drive you crazy if you try to sit through it all.
*El análisis de mercado publicado aquí está destinado a aumentar su conocimiento, pero no a dar instrucciones sobre cómo realizar una operación
 Español
  Русский
 English
 Bahasa Indonesia
 Bahasa Malay
 ไทย
ไทย Deutsch
 Български
 Français
 Tiếng Việt
 中文
中文 বাংলা
বাংলা हिन्दी
 Čeština
 Українська
 Română
Comentarios: