 Bahasa Indonesia
  Русский
 English
 Bahasa Malay
 ไทย
ไทย Español
 Deutsch
 Български
 Français
 Tiếng Việt
 中文
中文 বাংলা
বাংলা हिन्दी
 Čeština
 Українська
 Română
FX.co ★ Portal Trader Forex
Berita Terbaik
Yang terbaik saat ini
 Relevan hingga
 Relevan hingga
Suku bunga tinggi akan berdampak buruk bagi pasar saham?
Banyak pemodal yang khawatir mengenai pemeliharaan jangka panjang dari suku bunga acuan yang tinggi. Namun, para lawan mereka percaya bahwa suku bunga yang tinggi tidak selalu berarti bencana bagi pasar...
 Relevan hingga
 Relevan hingga
 Relevan hingga
 Relevan hingga
 Relevan hingga
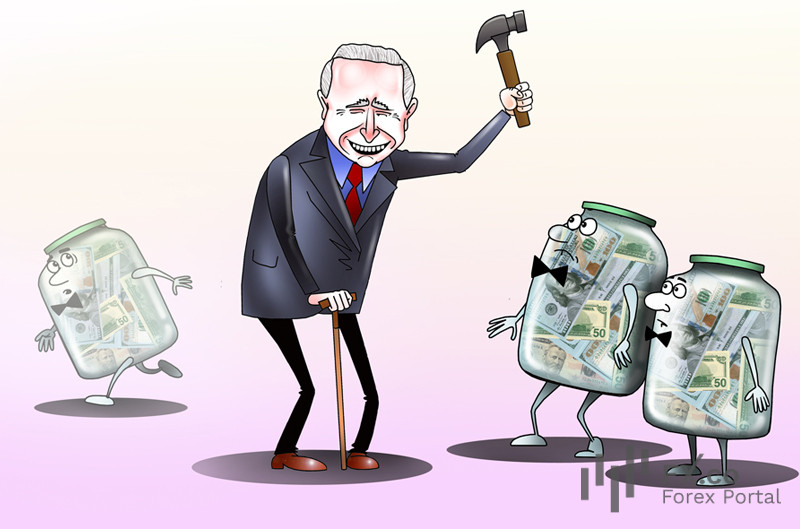
Kekhawatiran perekonomian global disoroti oleh IMF dan Bank Dunia
Joe Biden, presiden AS, meyakini kekuatan perekonomian Amerika, sebuah sentimen yang sulit dibantah. Namun, sejumlah gubernur bank sentral dan menteri keuangan menentang pernyataan ini. Meskipun keyakinan sang pemimpin Amerika...
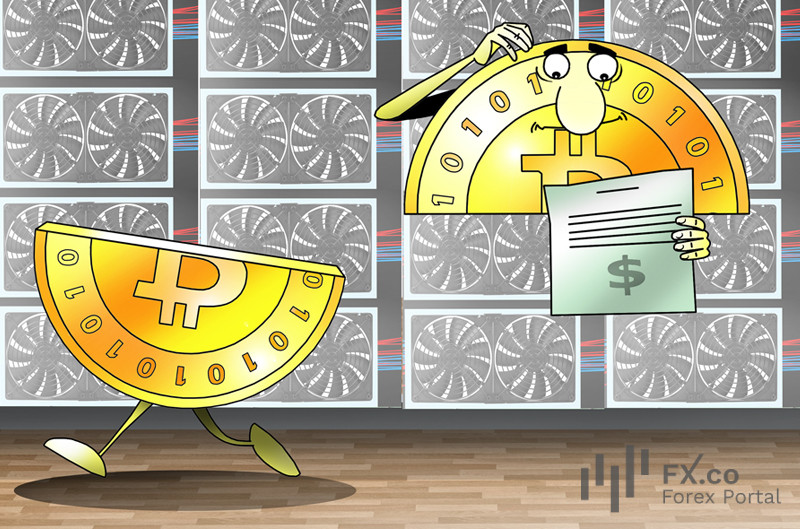
Deutsche Bank perkirakan tidak ada lonjakan besar pasca-halving Bitcoin
Halving Bitcoin adalah adalah peristiwa yang sangat dinantikan pada pasar cryptocurrency. Umumnya hal ini terjadi sebelum kenaikan tajam dalam aset digital. Namun kali ini situasinya berbeda. Penggemar crypto menaruh banyak...