The US dollar index remains in a bullish short-term trend. Price target mentioned in our last analysis has been achieved. There are also signs of bearish divergence providing a warning for dollar bulls.
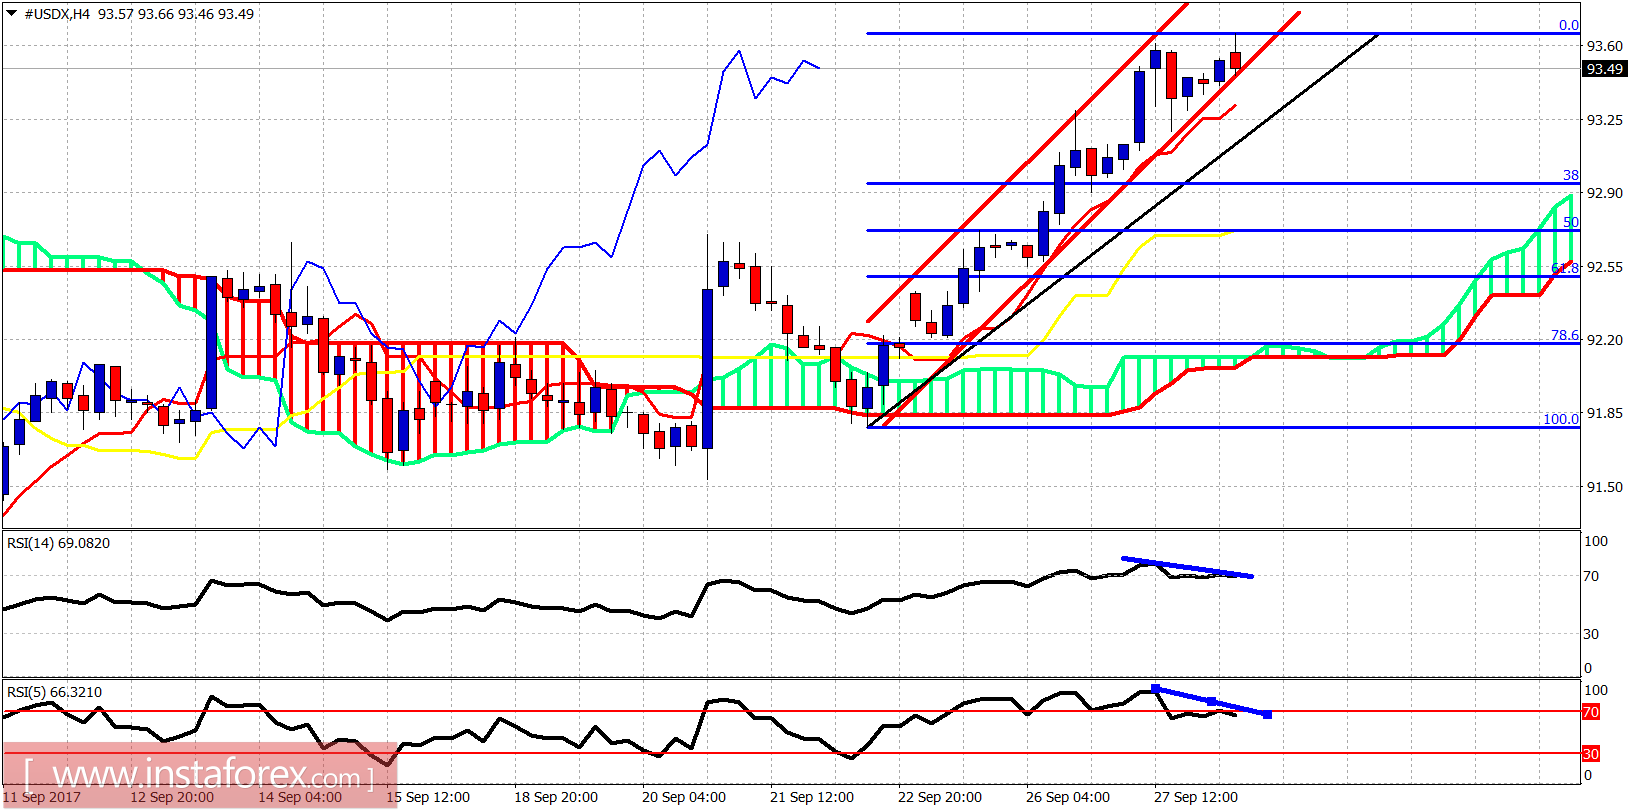
Red lines - bullish channel
The US dollar index is inside the bullish channel. Both RSI indicators are diverging. Price could make a pullback towards 92.95 which is the short-term support and the 38% Fibonacci retracement of the latest rise. Cloud support is at 92.20. As long as we trade above it, the short-term trend is bullish.
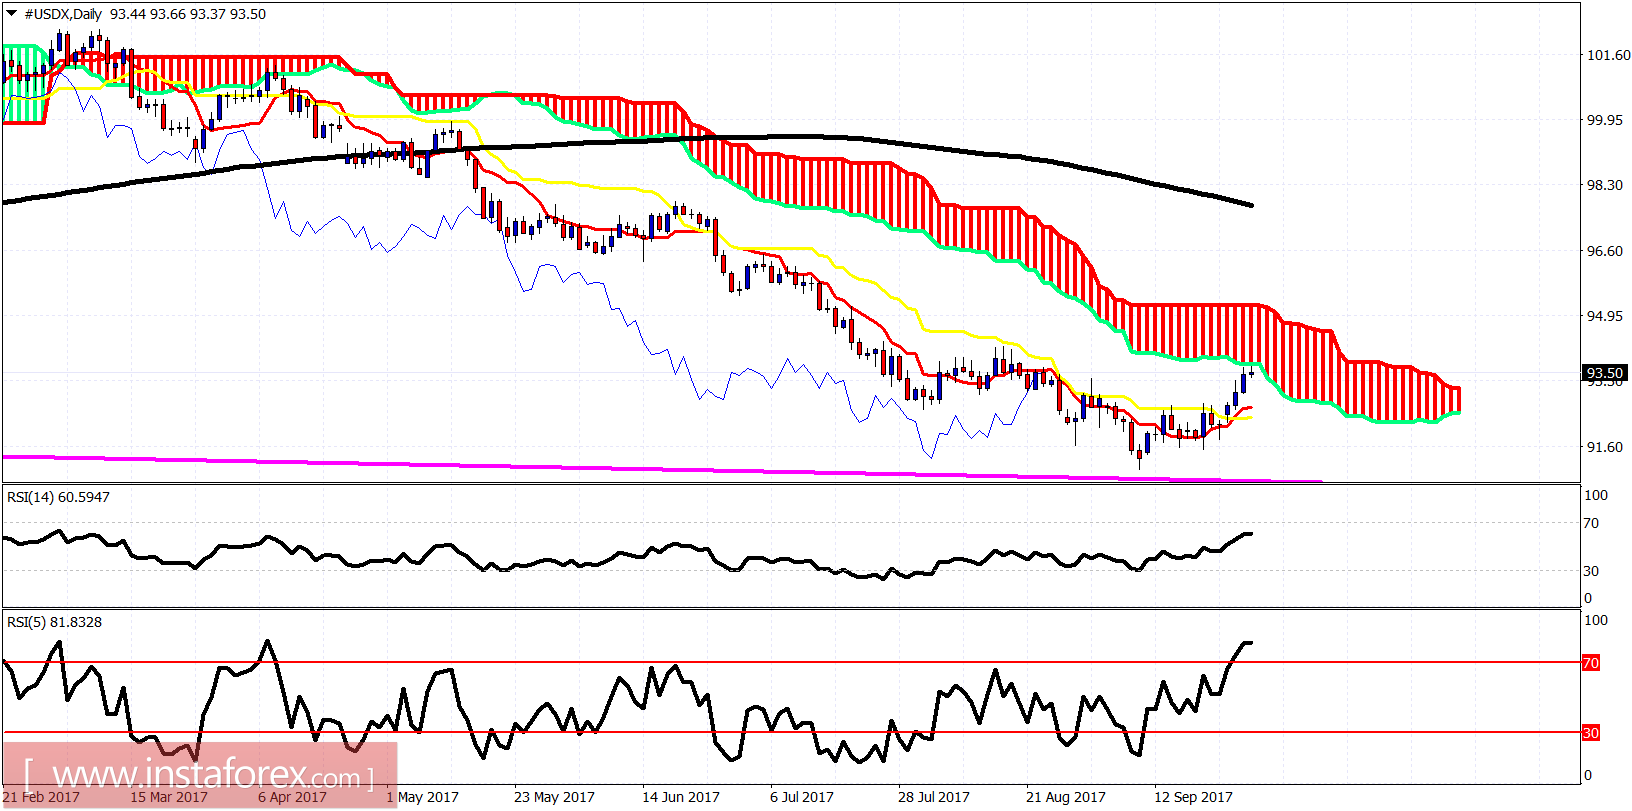
As expected, the dollar index has reached the Ichimoku cloud resistance. Price is above both the tenkan-sen and kijun-sen but below the Kumo (cloud). Trend is bullish in the short-term but in medium-term the trend remains bearish. This bounce is still considered as a short-term correction to the bigger downward trend. I expect price to get rejected and provide new lows towards 90.
*The market analysis posted here is meant to increase your awareness, but not to give instructions to make a trade
 English
  Русский
 Bahasa Indonesia
 Bahasa Malay
 ไทย
ไทย Español
 Deutsch
 Български
 Français
 Tiếng Việt
 中文
中文 বাংলা
বাংলা हिन्दी
 Čeština
 Українська
 Română
