 English
  Русский
 Bahasa Indonesia
 Bahasa Malay
 ไทย
ไทย Español
 Deutsch
 Български
 Français
 Tiếng Việt
 中文
中文 বাংলা
বাংলা हिन्दी
 Čeština
 Українська
 Română

Gold price made a new lower low at $1,278 where the next support level was found. As said in our previous analysis, a new lower low does not cancel our bullish view. A pullback is seen as a buying opportunity, and bullish divergence signs here are signalling that downside is limited.
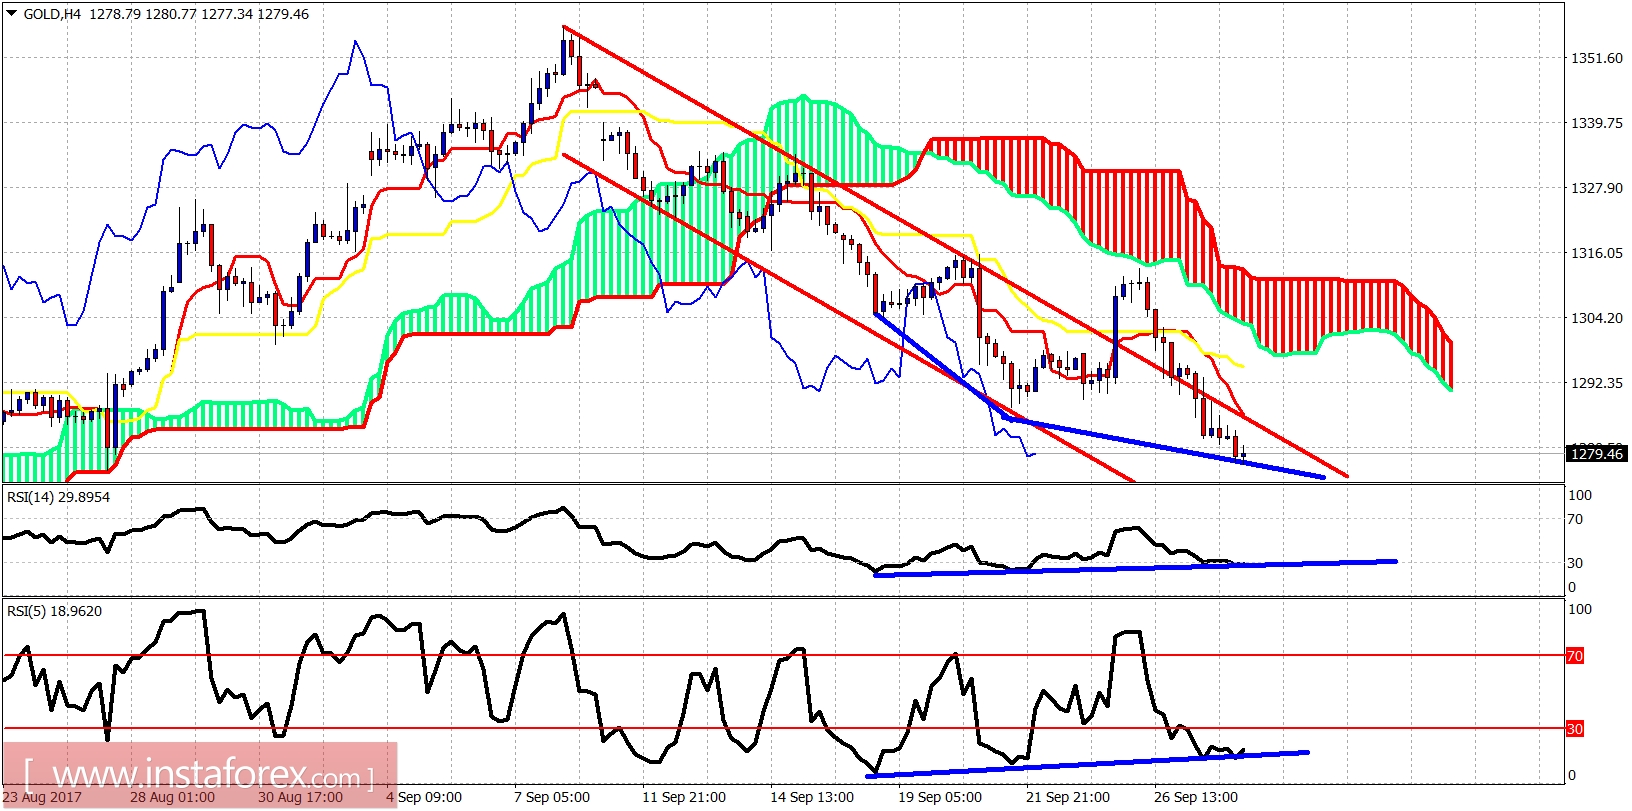
Gold price has entered inside the bearish channel after being rejected at the 4hour Kumo (cloud) resistance. Both RSI indicators are diverging. Gold should bounce strongly soon. Resistance is at $1,297 and the next one lies at $1,317.
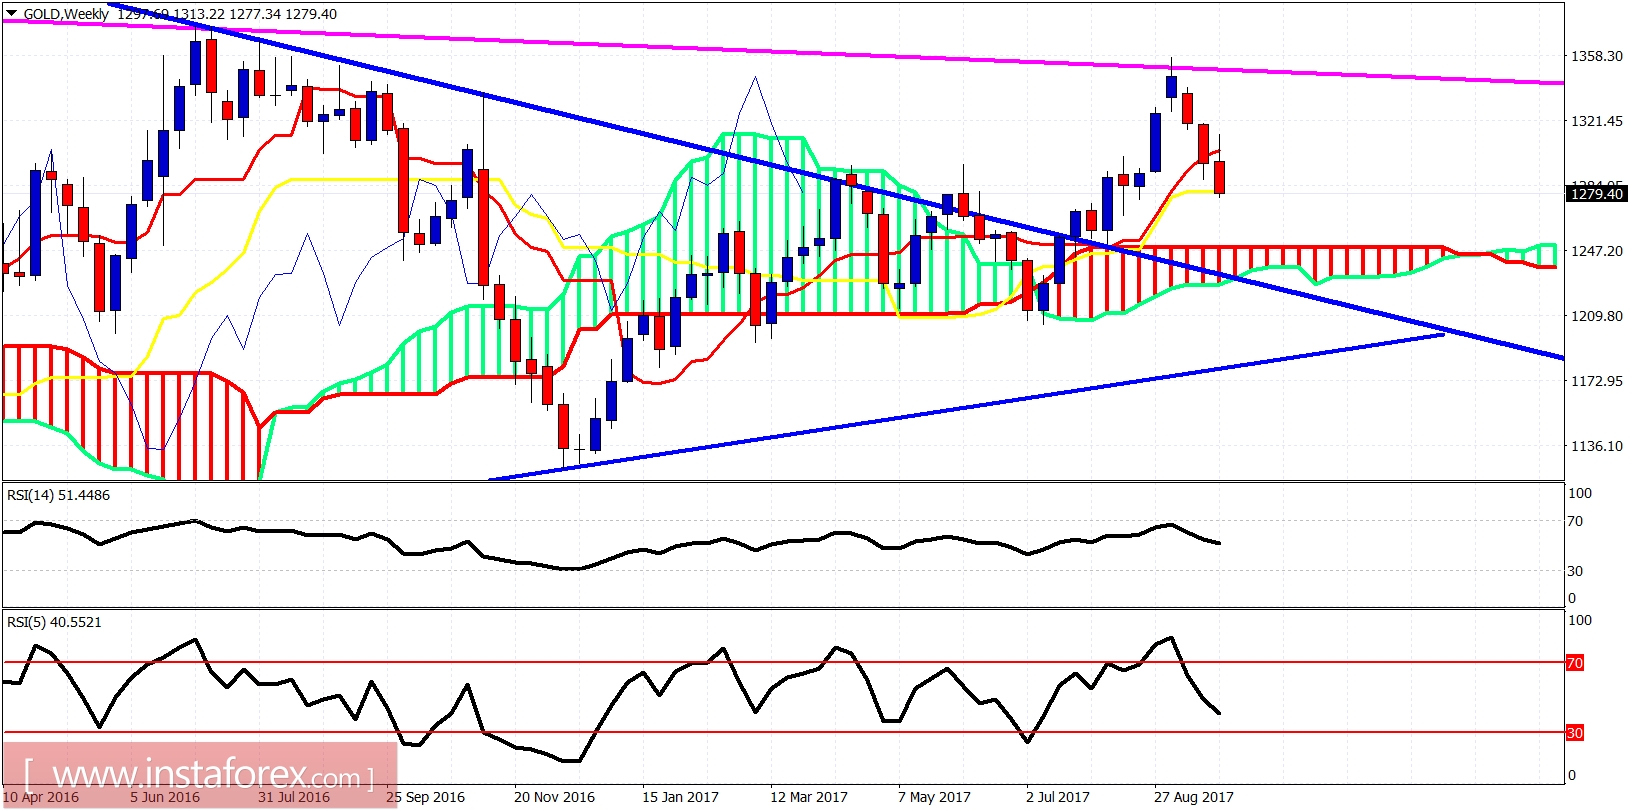
On a weekly basis, gold is making a corrective pullback towards the kijun-sen. If you remember our previous posts, we said that since the tenkan-sen is broken, we should move lower towards the kijun-sen. Now we are here right on the weekly support. The price is above the weekly cloud. Our longer-term view remains bullish looking for a move above $1,400.