 English
  Русский
 Bahasa Indonesia
 Bahasa Malay
 ไทย
ไทย Español
 Deutsch
 Български
 Français
 Tiếng Việt
 中文
中文 বাংলা
বাংলা हिन्दी
 Čeština
 Українська
 Română

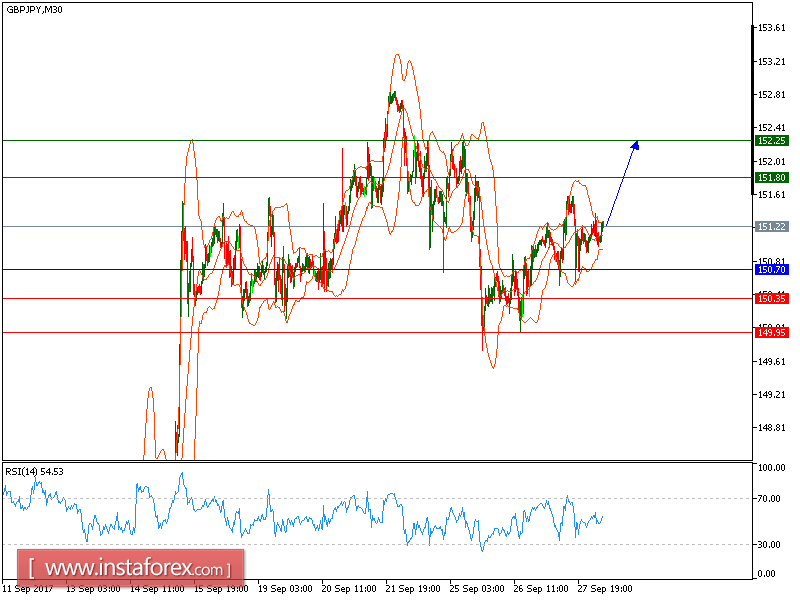
We will retain our yesterday's prediction of GBP/JPY that it is expected to trade with a bullish outlook. The pair is facing the challenge of its key support level at 150.70 and is likely to test it in the coming trading hours. The technical indicator such as the relative strength index is mixed and calls for caution. Furthermore, the 20-period moving average is flat now.
To sum up, as long as 150.70 holds on the downside, look for a choppy price action with the bullish bias. Our next up target is set at 151.80.
Alternatively, if the price moves in the direction opposite to the forecast, a short position is recommended below 150.30 with the target at 150.35.
Strategy: BUY, Stop Loss: 150.70, Take Profit: 151.80
Chart Explanation: the black line shows the pivot point. The price above the pivot point indicates long positions; and when it is below the pivot points, it indicates short positions. The red lines show the support levels and the green line indicates the resistance levels. These levels can be used to enter and exit trades.
Resistance levels: 151.80, 152.25 and 153.00
Support levels: 150.35, 149.95, and 149.15