 English
  Русский
 Bahasa Indonesia
 Bahasa Malay
 ไทย
ไทย Español
 Deutsch
 Български
 Français
 Tiếng Việt
 中文
中文 বাংলা
বাংলা हिन्दी
 Čeština
 Українська
 Română

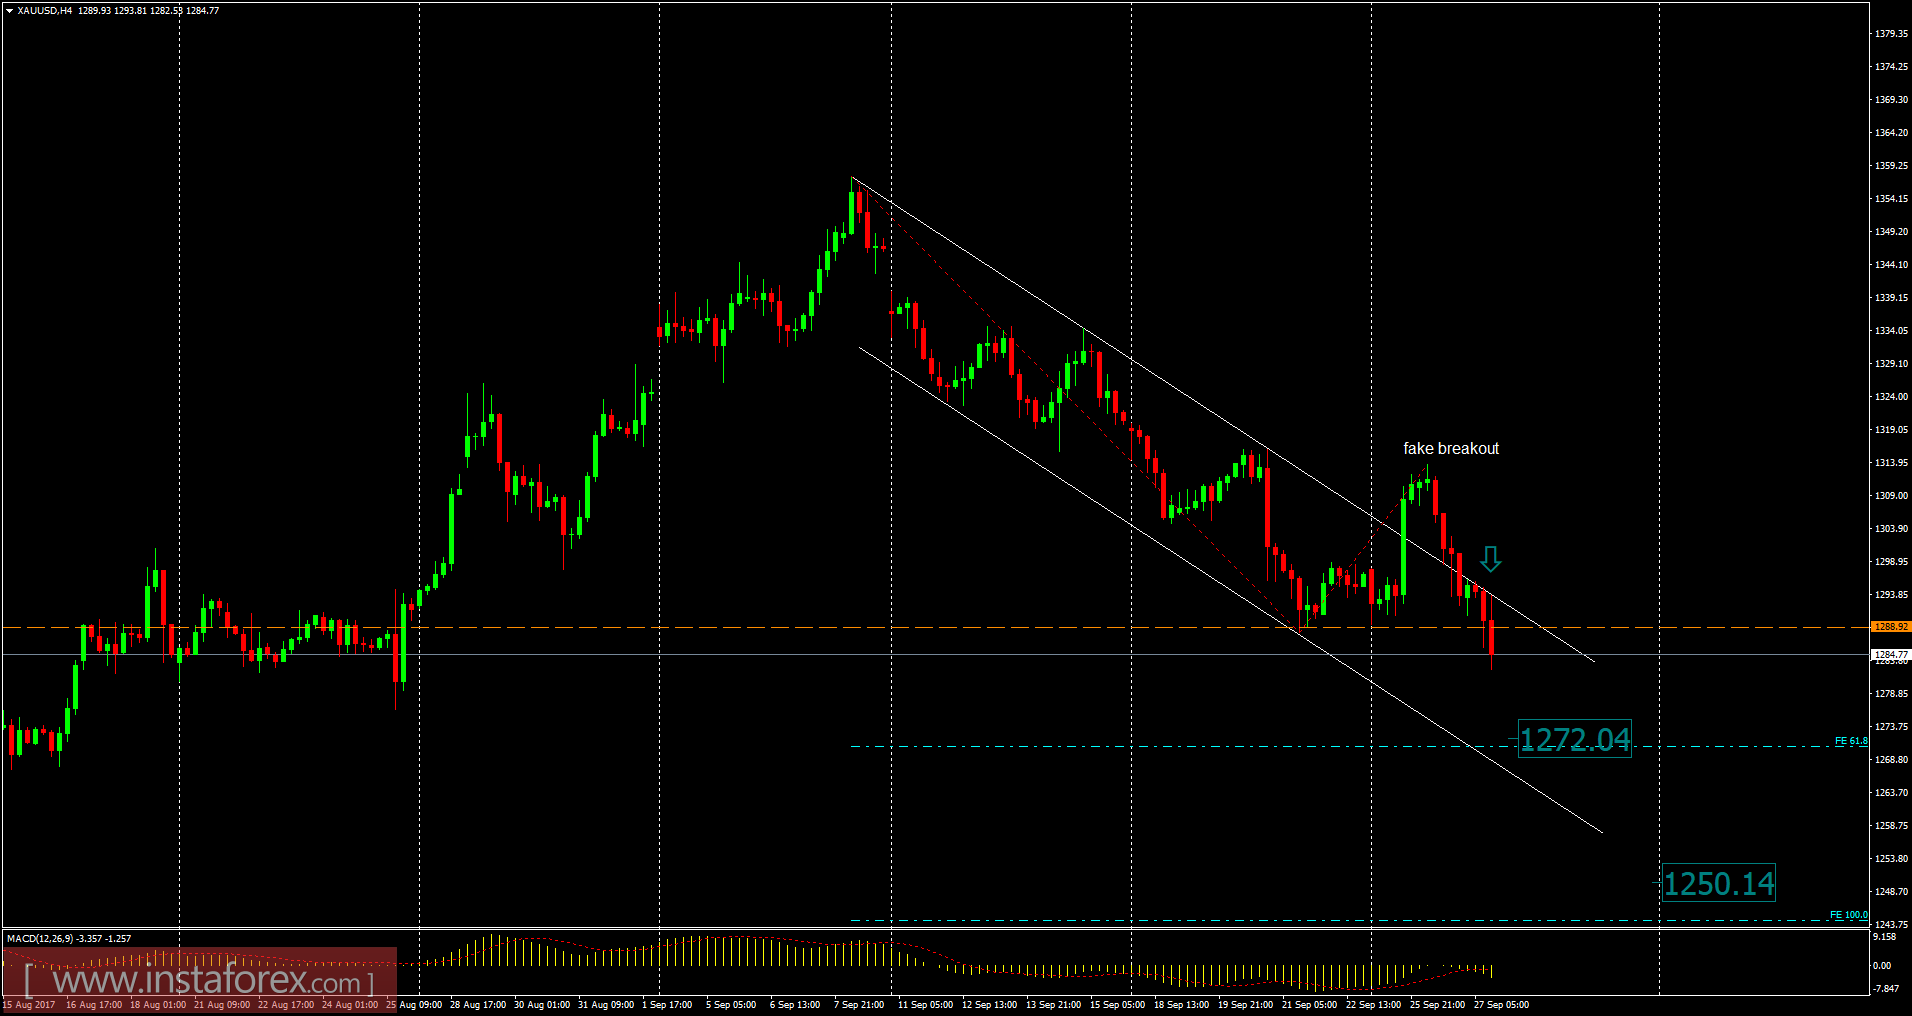
Recently, Gold has been trading downwards. The price tested the level of $1,282.00. According to the 4H time frame, I found a breakout of previous week low at the price of $1,289.00, which is a sign that sellers are in control. I also found a fake breakout of the downward channel, which is another sign of weakness. My advice is to watch for potential selling opportunities. The downawrd targets are set at the price of $1,272.00 and $1,250.00 (both targets are based on Fibonacci wrok).
Resistance levels:
R1: $1,314.00
R2: $1,326.50
R3: $1,336.40
Support levels:
S1: $1,292.18
S2: $1,282.60
S3: $1.270.00
Trading recommendations for today: watch for potential selling opportunities.