 English
  Русский
 Bahasa Indonesia
 Bahasa Malay
 ไทย
ไทย Español
 Deutsch
 Български
 Français
 Tiếng Việt
 中文
中文 বাংলা
বাংলা हिन्दी
 Čeština
 Українська
 Română

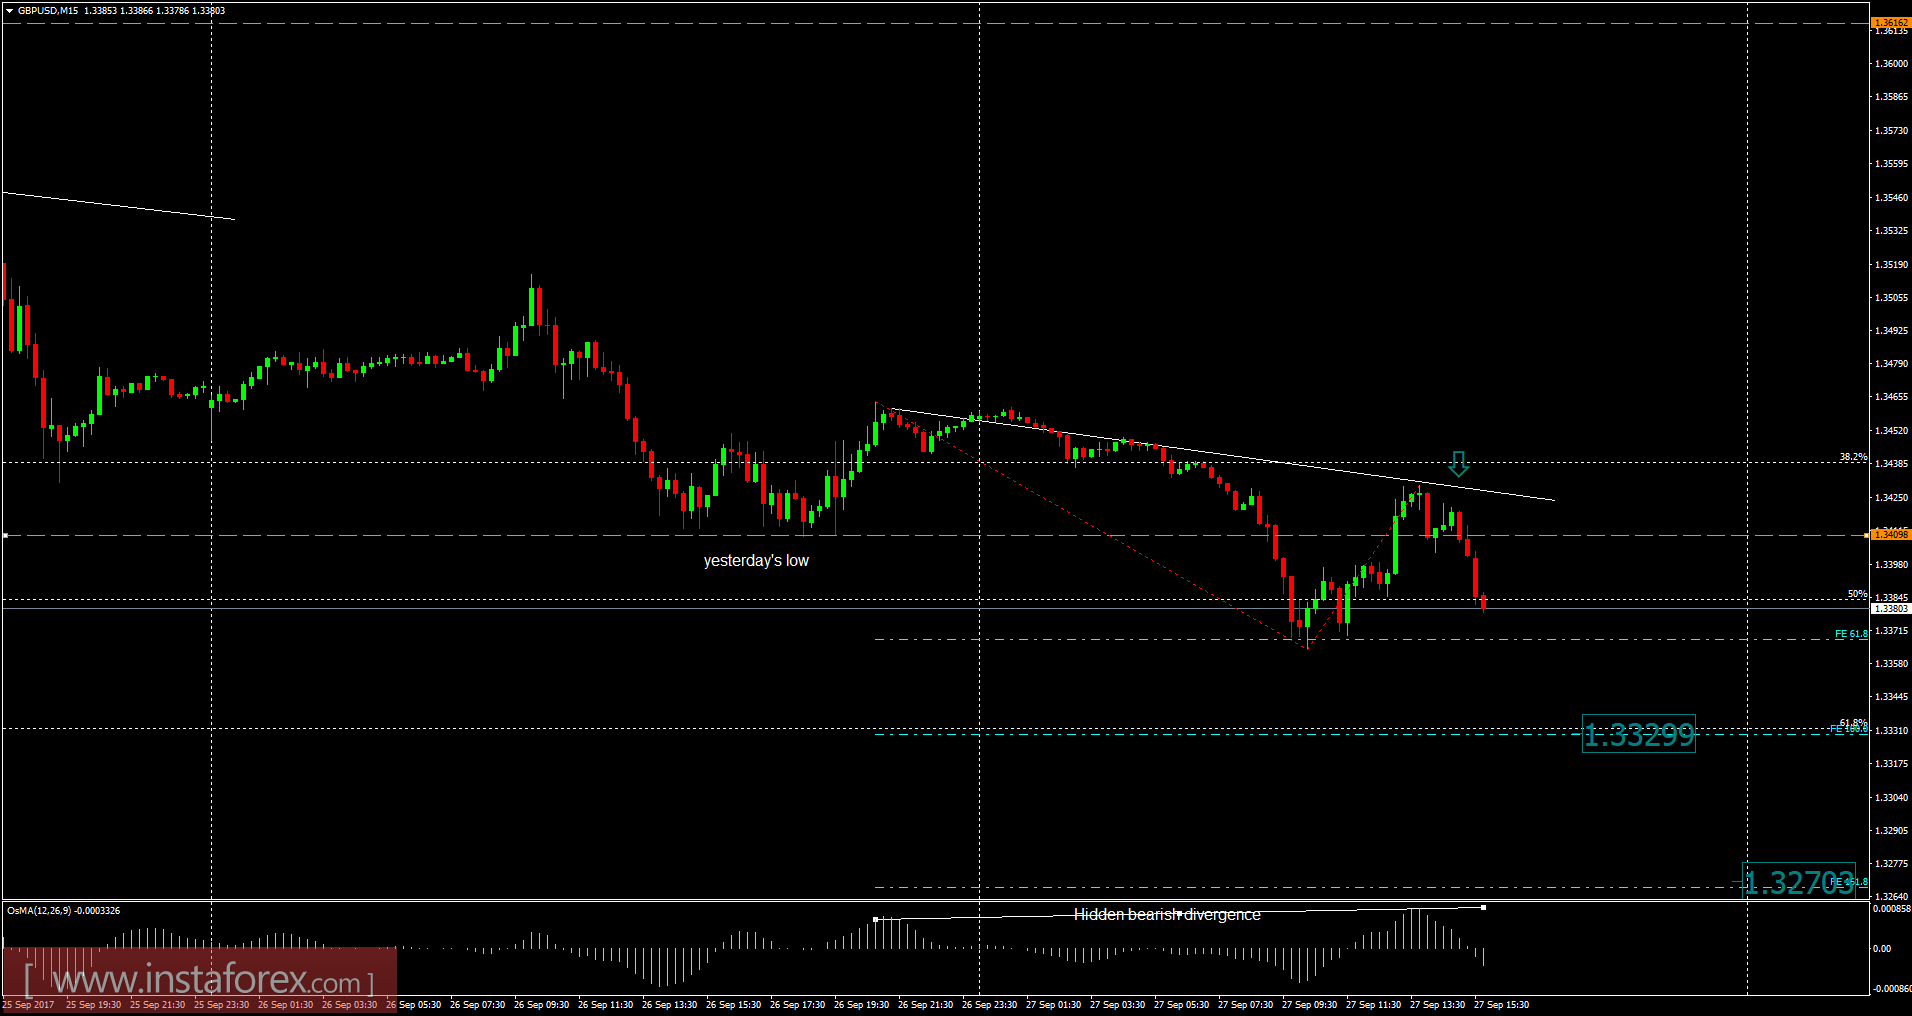
Recently, the GBP/USD has been trading downwards. As I expected, the price tested the level of 1.3363. According to the 15M time frame, I found a breakout of yesterday's low at the price of 1.3410, which is a sign that sellers are in control. I placed Fibonacci expansion from most recent swings to find potential downward targets. I got FE 100% at the price of 1.3330 and FE 161.8% at the price of 1.3270.
Resistance levels:
R1: 1.3514
R2: 1.3570
R3: 1.3620
Support levels:
S1: 1.3410
S2: 1.3355
S3: 1.3300
Trading recommendations for today: watch for potential selling opportunities.