 English
  Русский
 Bahasa Indonesia
 Bahasa Malay
 ไทย
ไทย Español
 Deutsch
 Български
 Français
 Tiếng Việt
 中文
中文 বাংলা
বাংলা हिन्दी
 Čeština
 Українська
 Română

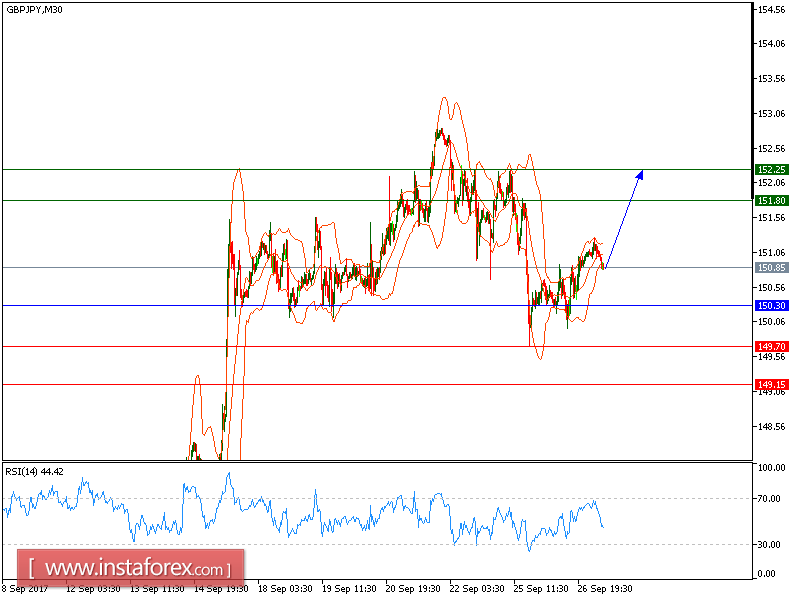
GBP/JPY is expected to trade with a bullish outlook. From a technical point of view, the relative strength index validated a bullish divergence. At the same time, the 20-period moving average crossed above the 50-period one, triggering a bullish signal.
This is calling for long positions above 150.30 with targets at 151.80 and 152.25 in extension.
Alternatively, if the price moves in the direction opposite to the forecast, a short position is recommended below 150.30 with the target at 149.70.
Strategy: BUY, Stop Loss: 150.30, Take Profit: 151.80
Chart Explanation: the black line shows the pivot point. The price above the pivot point indicates long positions; and when it is below the pivot points, it indicates short positions. The red lines show the support levels and the green line indicates the resistance levels. These levels can be used to enter and exit trades.
Resistance levels: 151.80, 152.25 and 153.00
Support levels: 149.70, 149.15, and 148.45