 English
  Русский
 Bahasa Indonesia
 Bahasa Malay
 ไทย
ไทย Español
 Deutsch
 Български
 Français
 Tiếng Việt
 中文
中文 বাংলা
বাংলা हिन्दी
 Čeština
 Українська
 Română

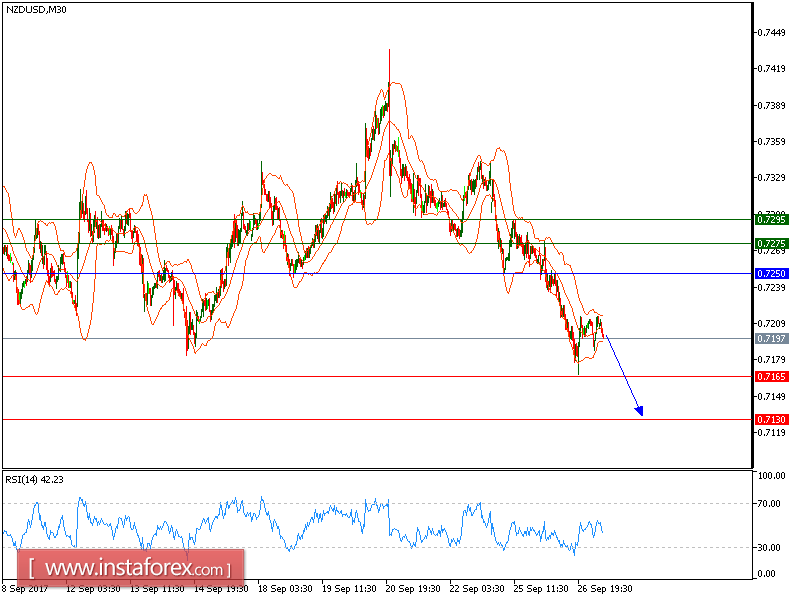
All our targets which we predicted in yesterday's analysis have been hit. The pair is expected to trade with a bearish outlook. Although the pair posted a rebound, it is still trading below its declining 50-period moving average. The relative strength index is below its neutrality level at 50. The upside potential should be limited by the key resistance at 0.7250.
Hence, as long as this key level is not surpassed, a further decline to 0.7165 and even to 0.7130 seems more likely to occur.
The black line is showing the pivot point. Currently, the price is above the pivot point, which indicates long positions. If it remains below the pivot point, it will indicate short positions. The red lines is showing the support levels and the green line is indicating the resistance levels. These levels can be used to enter and exit trades.
Resistance levels: 0.7275, 0.7295, and 0.7325
Support levels: 0.7165, 0.7130, and 0.7100