 English
  Русский
 Bahasa Indonesia
 Bahasa Malay
 ไทย
ไทย Español
 Deutsch
 Български
 Français
 Tiếng Việt
 中文
中文 বাংলা
বাংলা हिन्दी
 Čeština
 Українська
 Română

Daily Outlook
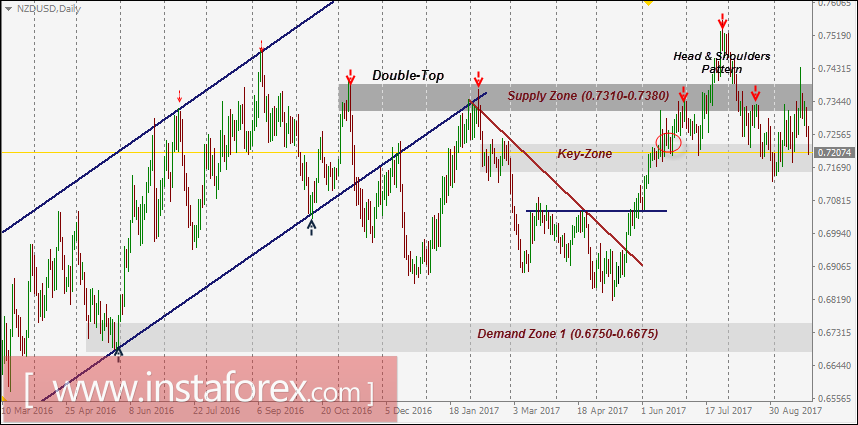
In February 2017, the depicted short-term downtrend was initiated around the depicted supply zone (0.7310-0.7380).
However, a recent bullish breakout above the downtrend line took place on May 22. Since then, the market has been bullish as depicted on the chart.
The price zone of 0.7150-0.7230 (Key-Zone) stood as a temporary resistance zone until a bullish breakout was expressed above 0.7230.
This resulted in a quick bullish advance towards the next supply zone around 0.7310-0.7380 which was temporarily breached to the upside.
Recent bearish pullback was executed towards the price zone of 0.7310-0.7380 (newly-established demand-zone) which failed to offer enough bullish support for the NZD/USD pair.
Re-consolidation below the price level of 0.7300 enhances the bearish side of the market. This brings the NZD/USD pair again towards 0.7230-0.7150 (Key-Zone) where recent weak bullish recovery was manifested earlier in September.
An atypical Head and Shoulders pattern is being expressed on the depicted chart indicating high probability of bearish reversal.
The current price levels of 0.7320-0.7350 can be watched for a valid SELL entry if enough bearish rejection is expressed.
Breakdown of the neckline 0.7150 confirms the reversal pattern. Expected bearish targets are located around 0.7050, 0.6925 and eventually 0.6800.