 English
  Русский
 Bahasa Indonesia
 Bahasa Malay
 ไทย
ไทย Español
 Deutsch
 Български
 Français
 Tiếng Việt
 中文
中文 বাংলা
বাংলা हिन्दी
 Čeština
 Українська
 Română

The Dollar index is testing important short-term resistance and previous high at 92.70. Trend is bullish. 93 is an important resistance level.
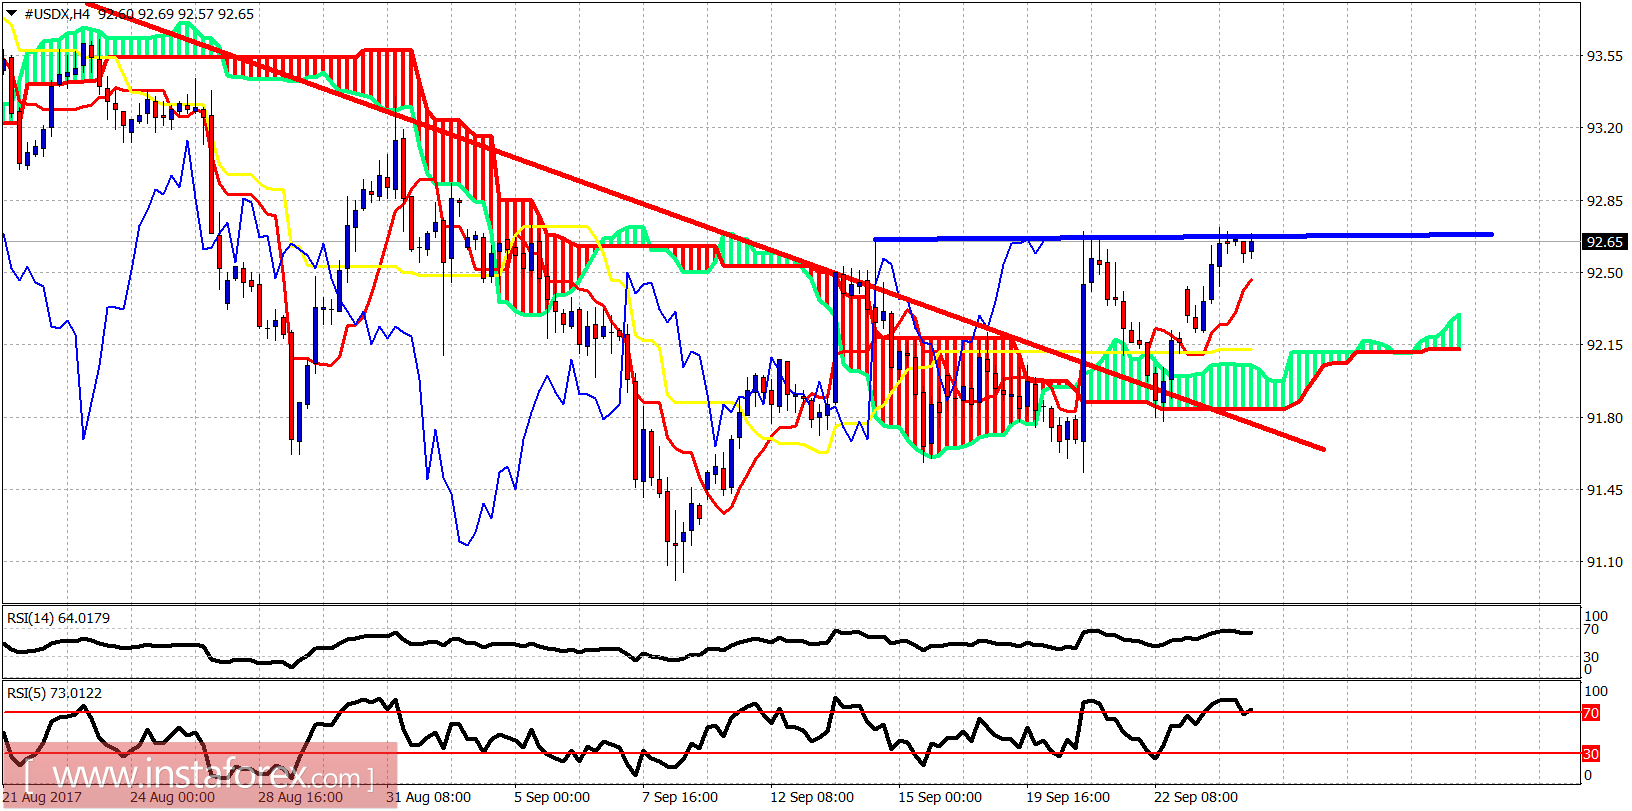
Blue line - previous high horizontal resistance
The Dollar index is trying to break above the previous highs at 92.70. Price back tested the cloud support and has reversed higher and is now ready to break to new short-term highs. Important support remains at 91.80.
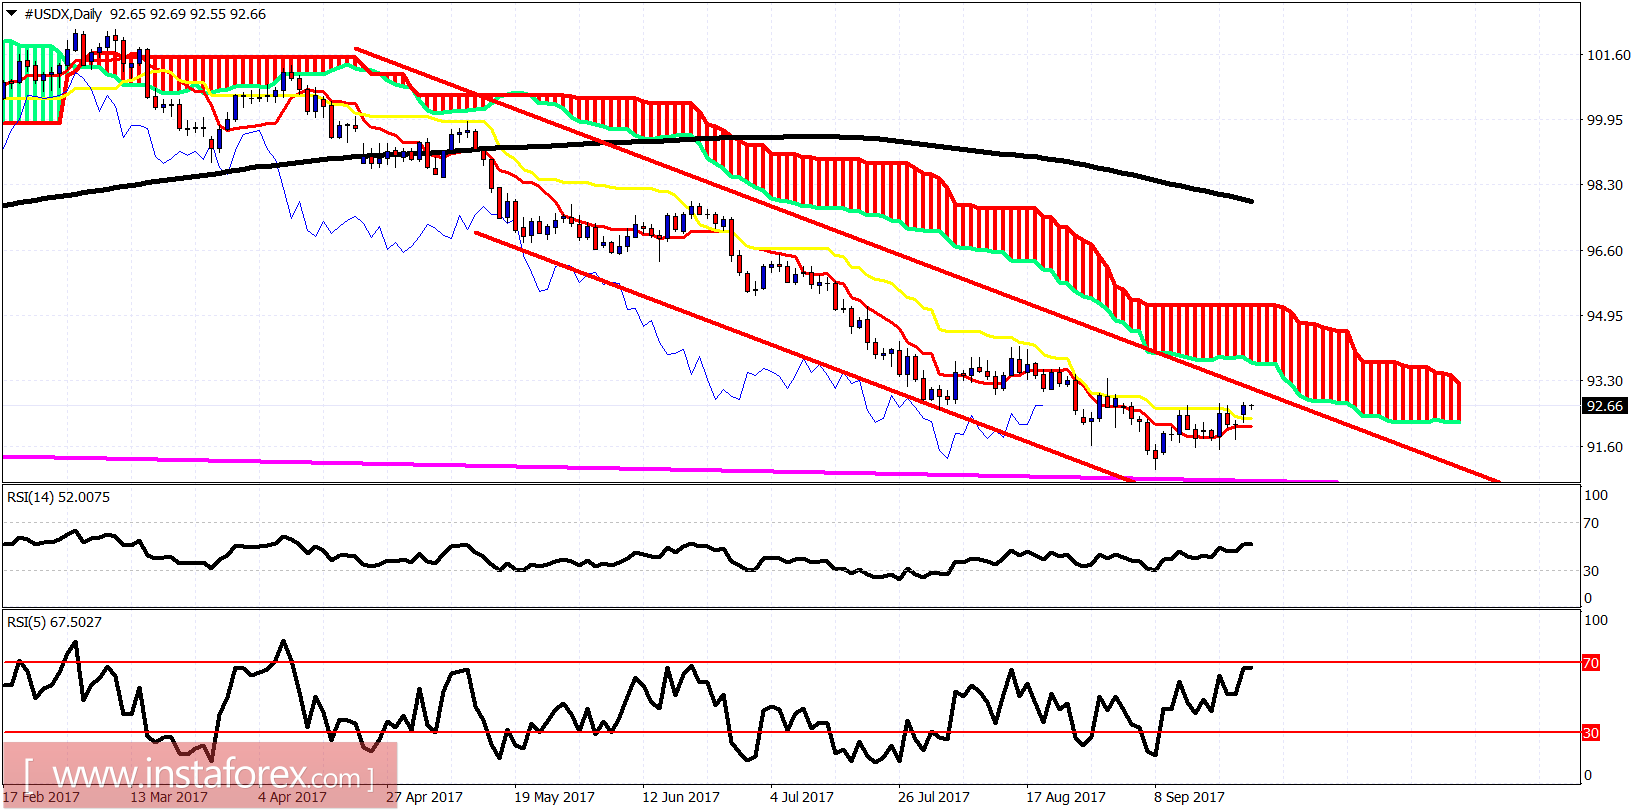
On a daily basis we consider that the Dollar index is making a bounce that has first important resistance at 93 and next at 93.70. Both targets can be met but I believe we will first see below 91, before a bigger bounce. Short-term trend is bullish but medium-term trend remains bearish. Breaking below 91.80 will open the way for a move towards 90 or lower.