Gold price has broken out of the bearish channel yesterday as we expected. Price has stopped right below the 4-hour Kumo and shows signs of rejection. However I believe the next leg up towards $1,400 has started.
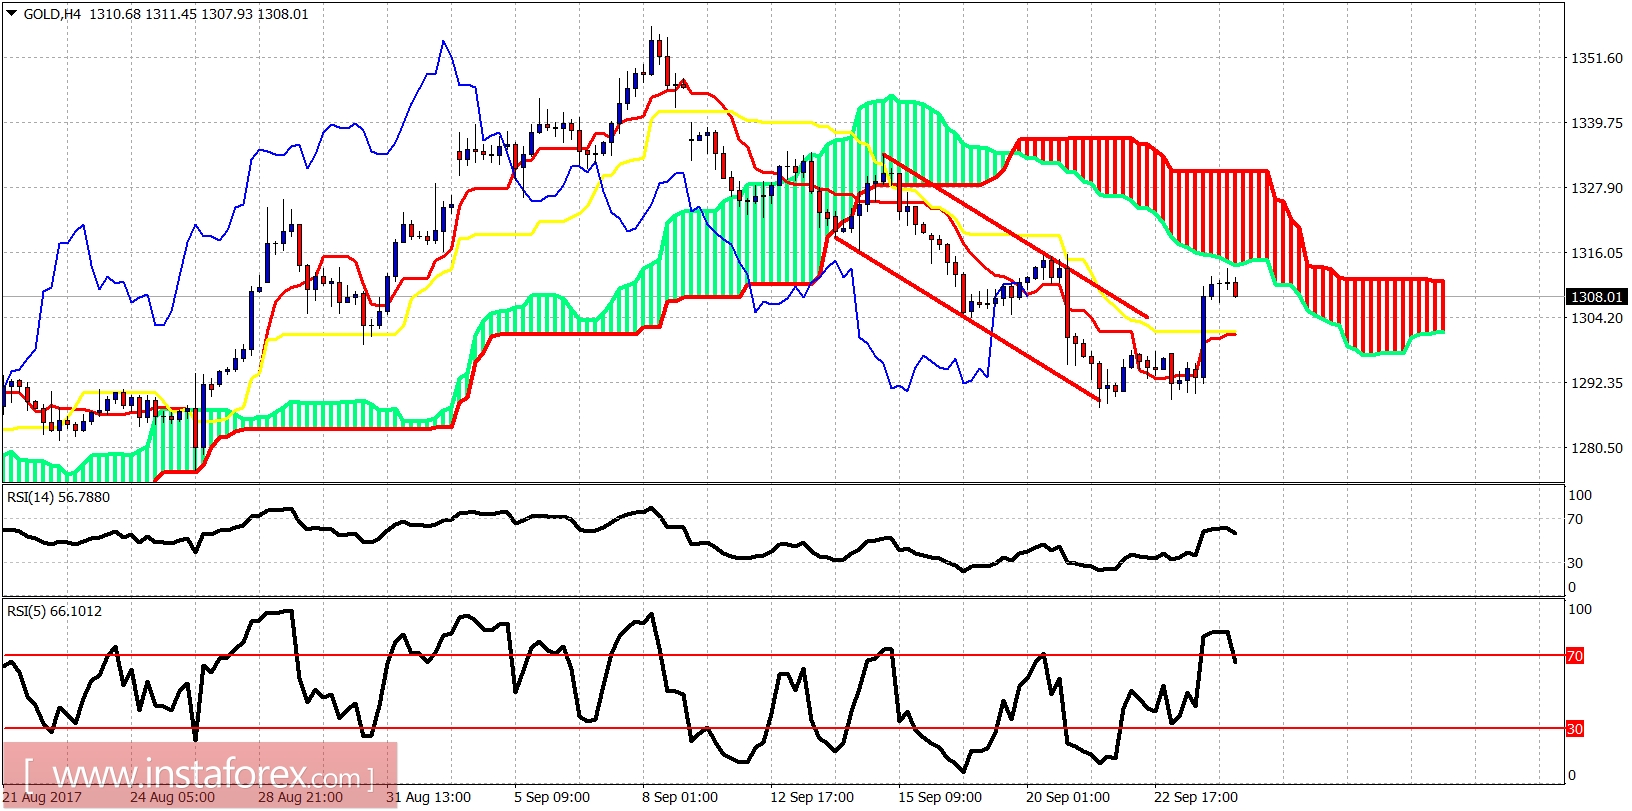
Red lines - bearish channel
Gold price has reached the 4-hour Kumo (cloud) after breaking the bearish channel. Price has stopped right at the resistance and is pulling back. Short-term support is at $1,301. Resistance is at $1,316.
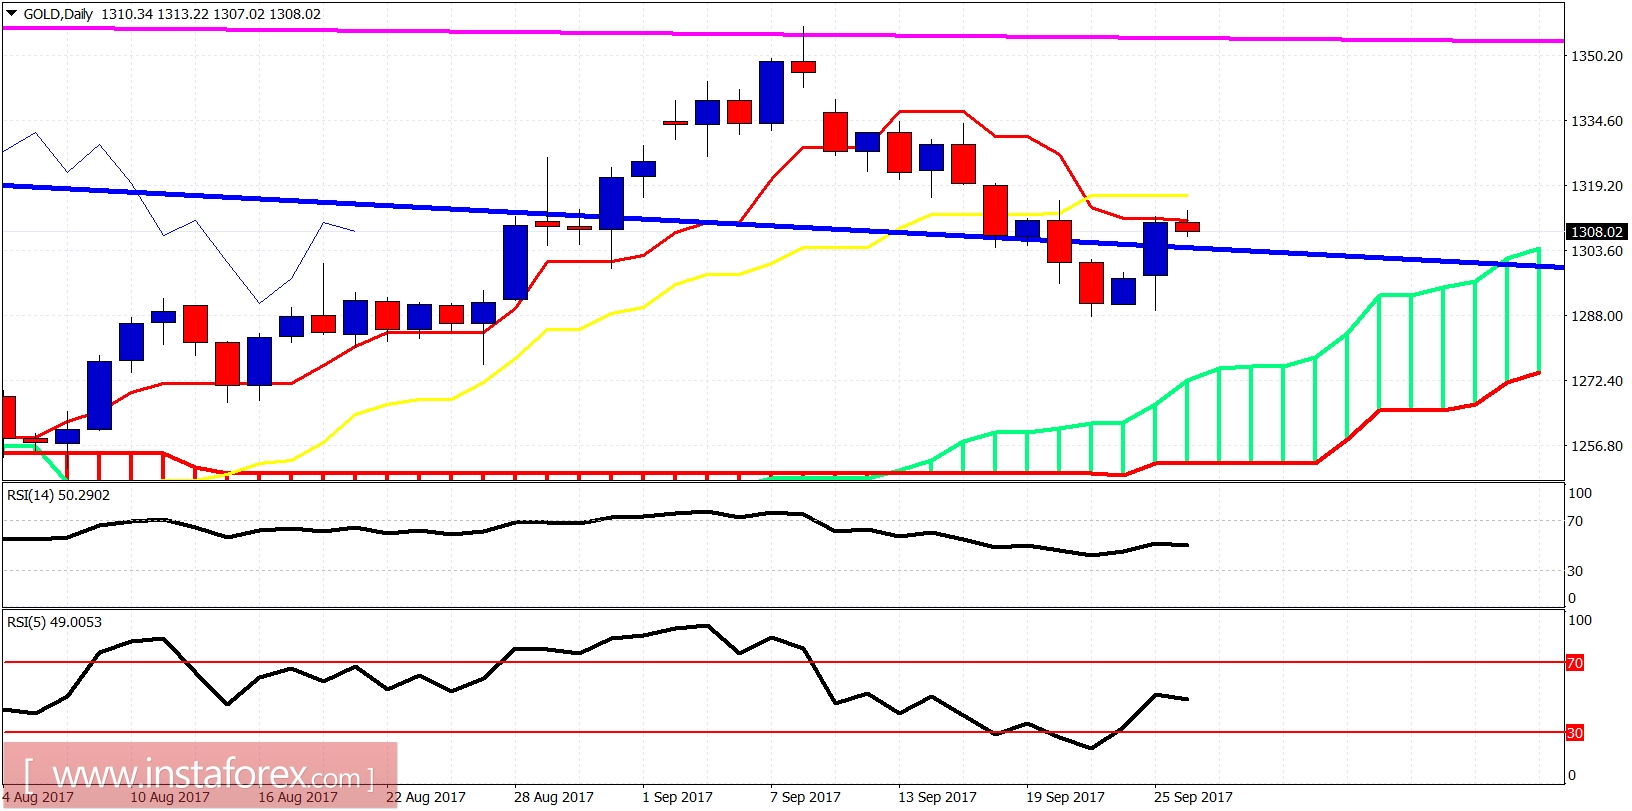
On a daily basis Gold price has bounced as expected and stopped right at the daily tenkan-sen (red line indicator) resistance. Price needs to move above $1,316-20 level in order for bulls to feel more confident. I believe Gold has made an important low at $1,288. Breaking below that level will open the way for a move towards $1,270-60.
*The market analysis posted here is meant to increase your awareness, but not to give instructions to make a trade
 English
  Русский
 Bahasa Indonesia
 Bahasa Malay
 ไทย
ไทย Español
 Deutsch
 Български
 Français
 Tiếng Việt
 中文
中文 বাংলা
বাংলা हिन्दी
 Čeština
 Українська
 Română
