 English
  Русский
 Bahasa Indonesia
 Bahasa Malay
 ไทย
ไทย Español
 Deutsch
 Български
 Français
 Tiếng Việt
 中文
中文 বাংলা
বাংলা हिन्दी
 Čeština
 Українська
 Română

GBP/USD started the week with a bearish gap that was filled during Asian hours of Monday's session. So far, the pair remains supported by the 200 SMA at H1 chart and looks forward to reaching the resistance zone of 1.3592, at which a breakout should expose the 1.3755 level. If the moving average gives up, declines could take place towards 1.3309.
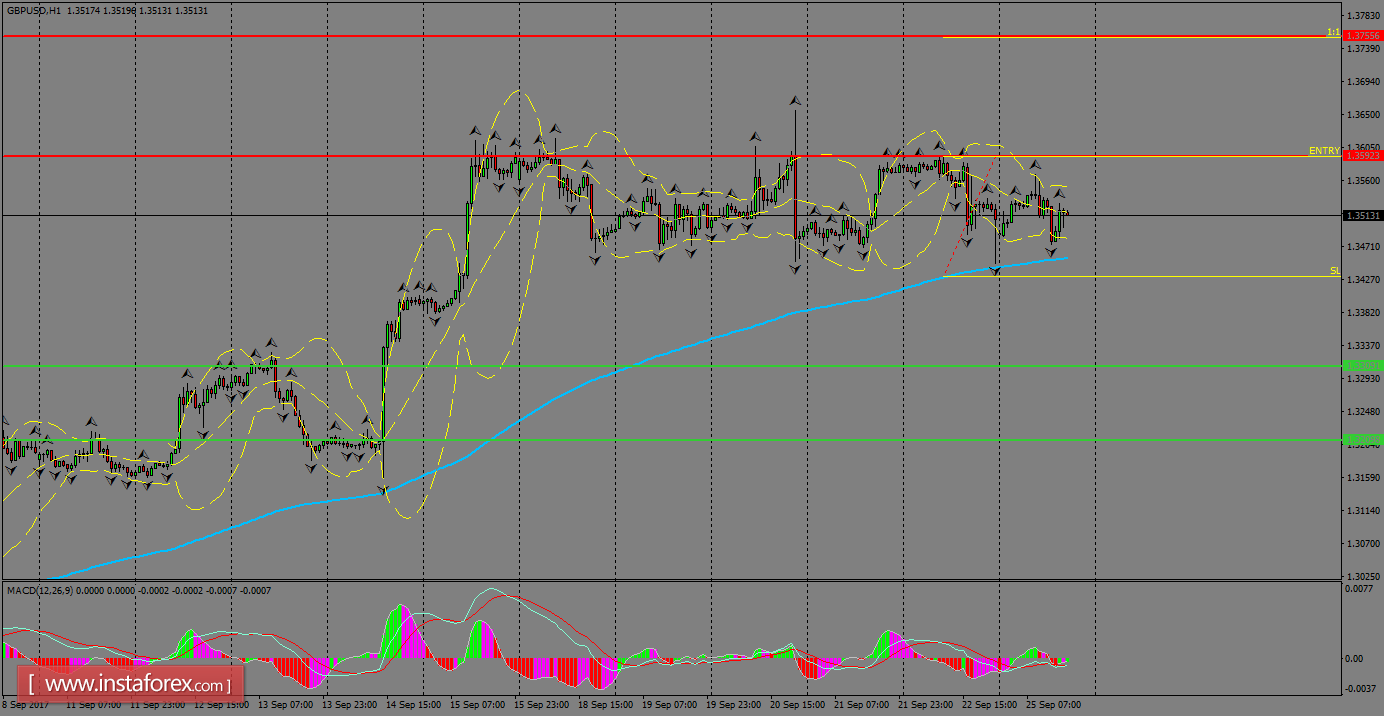
H1 chart's resistance levels: 1.3592 / 1.3755
H1 chart's support levels: 1.3309 / 1.3209
Trading recommendations for today: Based on the H1 chart, buy (long) orders only if the GBP/USD pair breaks a bullish candlestick; the resistance level is at 1.3592, take profit is at 1.3755 and stop loss is at 1.3430.