 English
  Русский
 Bahasa Indonesia
 Bahasa Malay
 ไทย
ไทย Español
 Deutsch
 Български
 Français
 Tiếng Việt
 中文
中文 বাংলা
বাংলা हिन्दी
 Čeština
 Українська
 Română

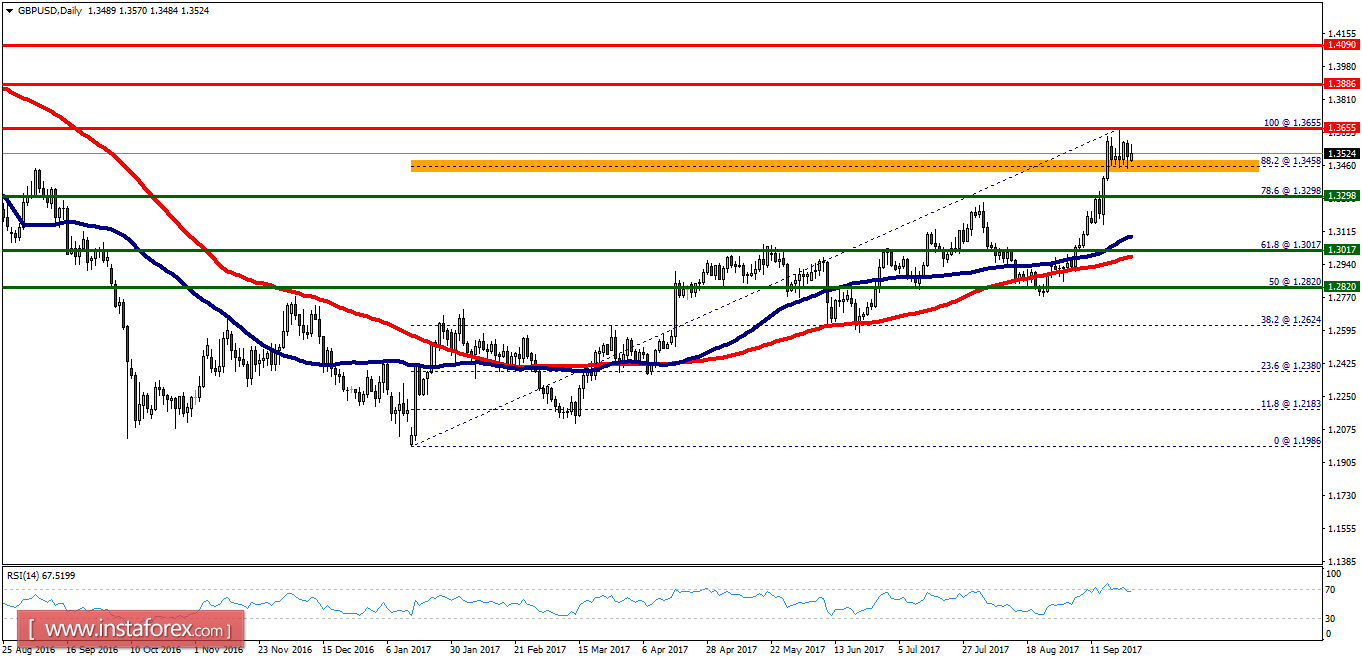
Overview:
- Pivot: 1.3458.
- The GBP/USD pair continues to move upwards from the level of 1.3458. Today, the first support level is currently seen at 1.3298, the price is moving in a bullish channel now.
- Furthermore, the price has been set above the strong support at the level of 1.3298, which coincides with the 78.6% Fibonacci retracement level.
- This support has been rejected three times confirming the veracity of an uptrend. According to the previous events, we expect the GBP/USD pair to trade between 1.3298 and 1.3655.
- So, the support is seen at 1.3298, while daily resistance is found at 1.3655. Therefore, the market is likely to show signs of a bullish trend around the spot of 1.3298.
- In other words, buy orders are recommended above the spot of 1.3298 with the first target at the level of 1.3655; and continue towards 1.3886 in coming days.
- However, if the GBP/USD pair fails to break through the resistance level of 1.3655 today, the market will decline further to 1.3298.