 English
  Русский
 Bahasa Indonesia
 Bahasa Malay
 ไทย
ไทย Español
 Deutsch
 Български
 Français
 Tiếng Việt
 中文
中文 বাংলা
বাংলা हिन्दी
 Čeština
 Українська
 Română

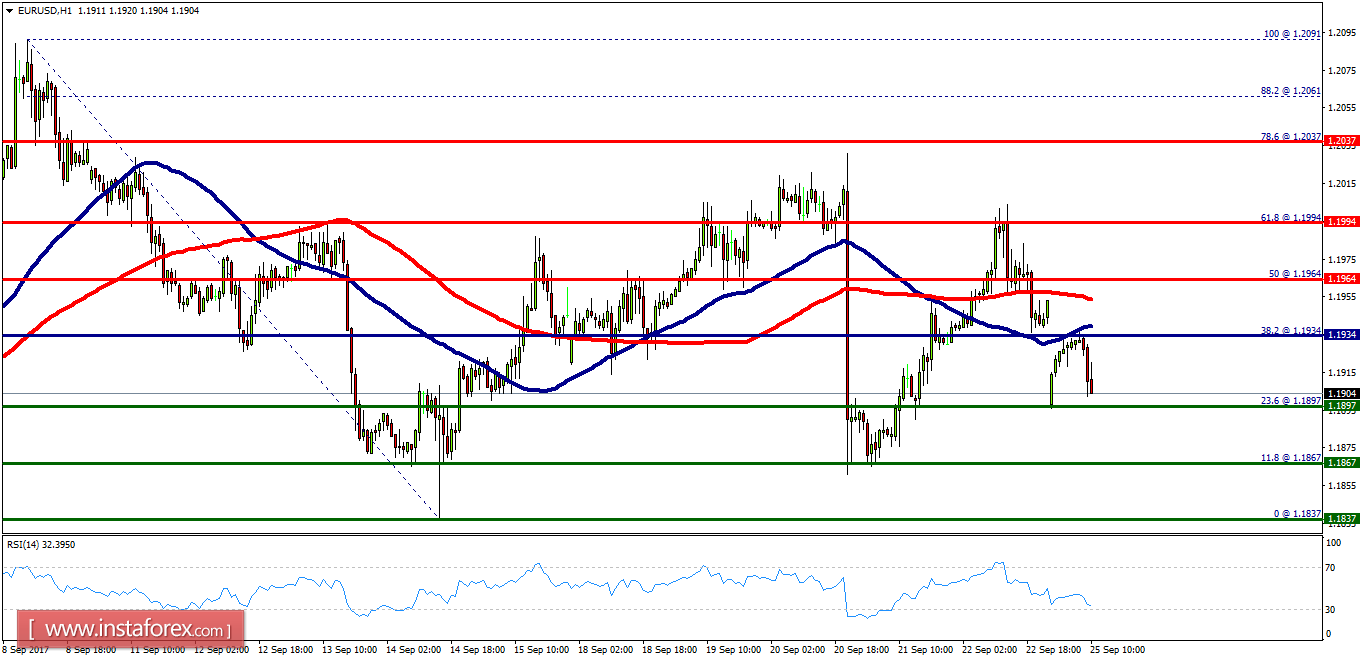
Overview:
- Last week, the EUR/USD pair fell from the level of 1.1994 towards 1.1897. Right now, the price is set at 1.1924. The resistance is seen at the level of 1.1994 and 1.2037. Moreover, the price area of 1.1994/1.2037 remains a significant resistance zone. Therefore, there is a possibility that the EUR/USD pair will move downside and the structure of a fall does not look corrective. The trend is still below the 100 EMA for that the bearish outlook remains the same as long as the 100 EMA is headed to the downside. Thus, amid the previous events, the price is still moving between the levels of 1.1964 and 1.1897. If the EUR/USD pair fails to break through the resistance level of 1.1994, the market will decline further to 1.1897 as the first target. This would suggest a bearish market because the RSI indicator is still in a negative spot and does not show any trend-reversal signs. The pair is expected to drop lower towards at least 1.1837 so as to test the double bottom. On the contrary, if a breakout takes place at the resistance level of 1.2037, then this scenario may become invalidated.