 English
  Русский
 Bahasa Indonesia
 Bahasa Malay
 ไทย
ไทย Español
 Deutsch
 Български
 Français
 Tiếng Việt
 中文
中文 বাংলা
বাংলা हिन्दी
 Čeština
 Українська
 Română

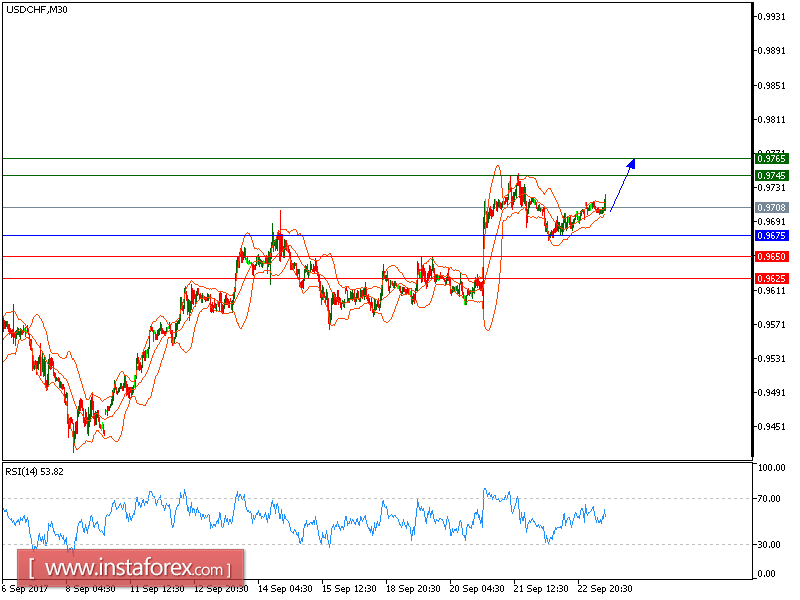
USD/CHF is expected to trade with a bearish outlook. The pair is supported by a rising trend line since September 22, which confirms a bullish view. The golden cross between the 20-period and 50-period moving averages has been identified, indicating a positive signal. The relative strength index is calling for a new upleg.
Therefore, as long as 0.9675 holds on the downside, look for a further rise with targets at 0.9745 and 0.9765 in extension.
Chart Explanation: The black line shows the pivot point. The present price above the pivot point indicates a bullish position, and the price below the pivot points indicates a short position. The red lines show the support levels and the green line indicates the resistance levels. These levels can be used to enter and exit trades.
Strategy: BUY, Stop Loss: 0.9675, Take Profit: 0.9745
Resistance levels: 0.9745, 0.9765, and 0.9795
Support levels: 0.9650, 0.9625, and 0.9775