 English
  Русский
 Bahasa Indonesia
 Bahasa Malay
 ไทย
ไทย Español
 Deutsch
 Български
 Français
 Tiếng Việt
 中文
中文 বাংলা
বাংলা हिन्दी
 Čeština
 Українська
 Română

The Dollar index made a bullish reversal on Friday and held above cloud and trend line support. This price action justifies continuation of the upward bounce as long as price is above 91.80.
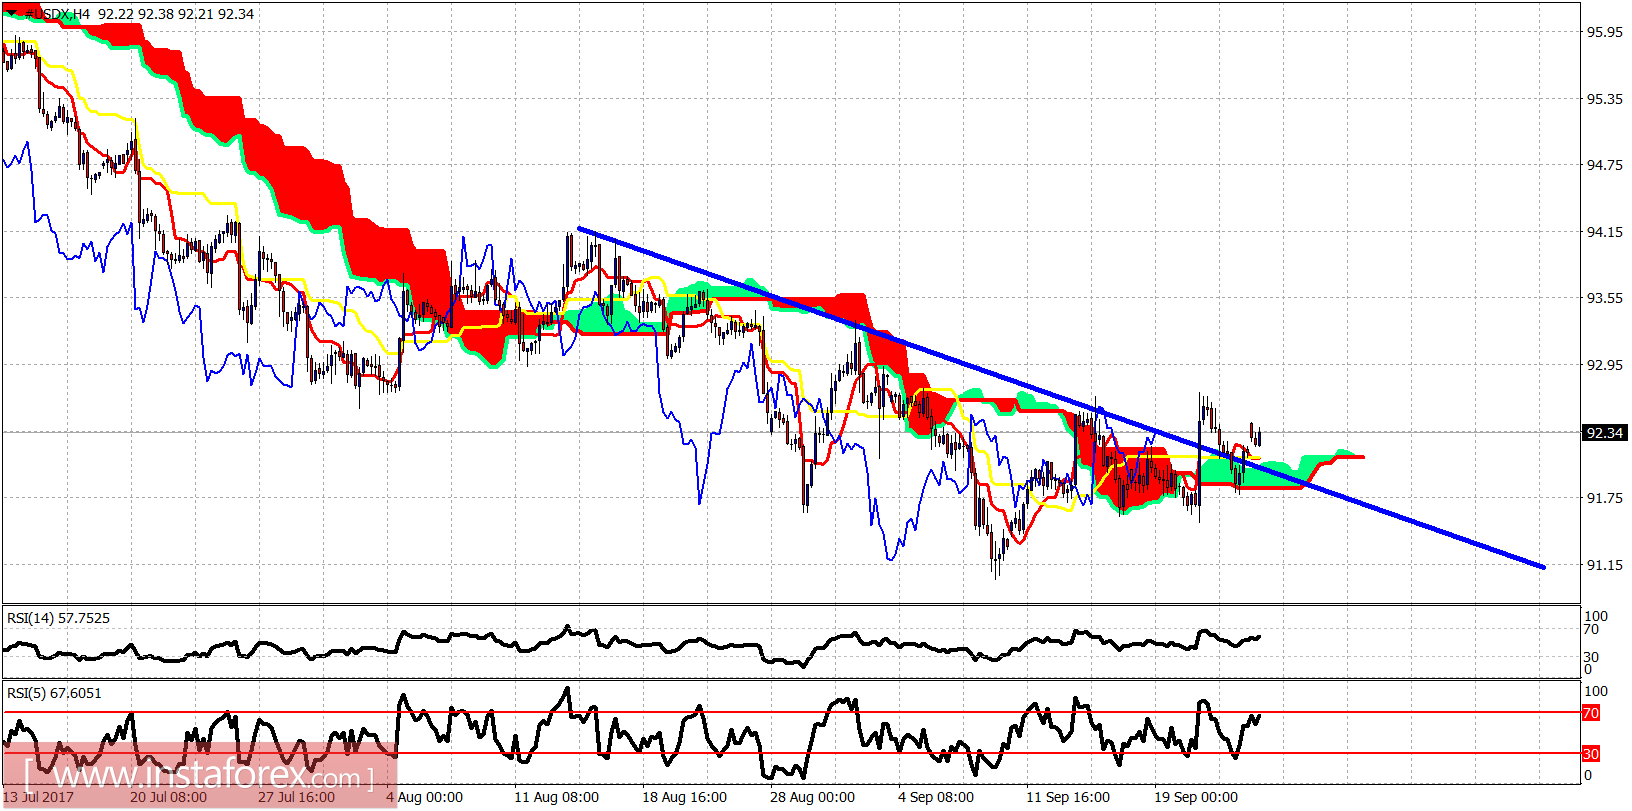
The Dollar index broke above the trend line and the 4-hour Kumo (cloud). It pulled back to back test the breakout area and is now bouncing higher. Bulls need to see a higher high above 92.70 to be more confident of the bullish short-term trend. Support is at 92-91.70 area.
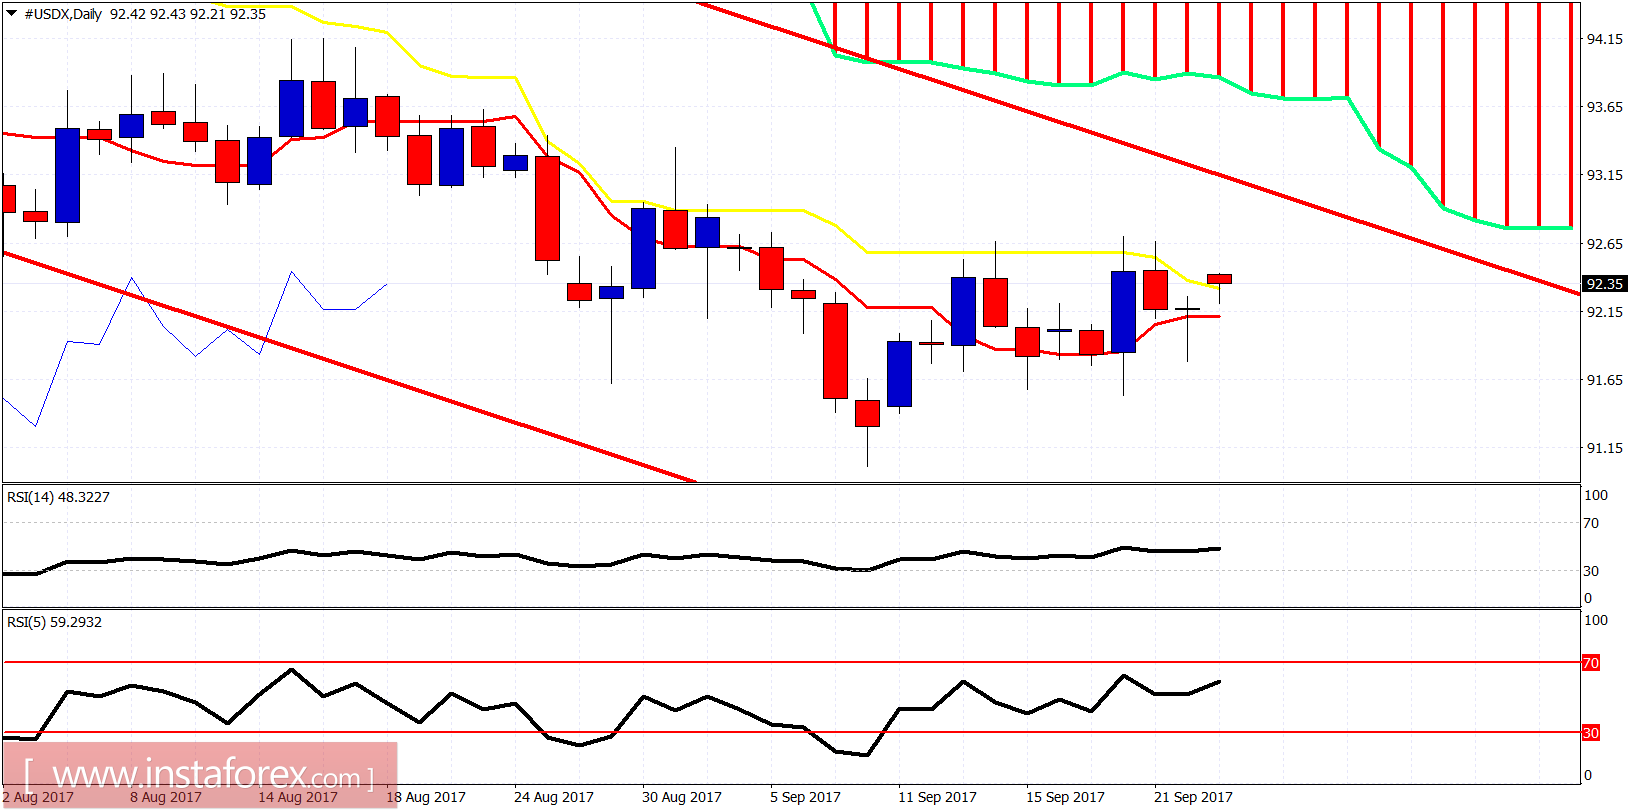
The Dollar index remains inside the daily bearish channel and below the daily Kumo (cloud). Price is now trading above the kijun-sen. A daily close above it will open the way for a move higher towards 93-94.