 English
  Русский
 Bahasa Indonesia
 Bahasa Malay
 ไทย
ไทย Español
 Deutsch
 Български
 Français
 Tiếng Việt
 中文
中文 বাংলা
বাংলা हिन्दी
 Čeština
 Українська
 Română

Gold price remains inside the bearish channel still. Price is trading above recent lows. There are increased chances of a new lower low towards $1,285-80 but I believe the downside is very limited, while the upside potential is very big.
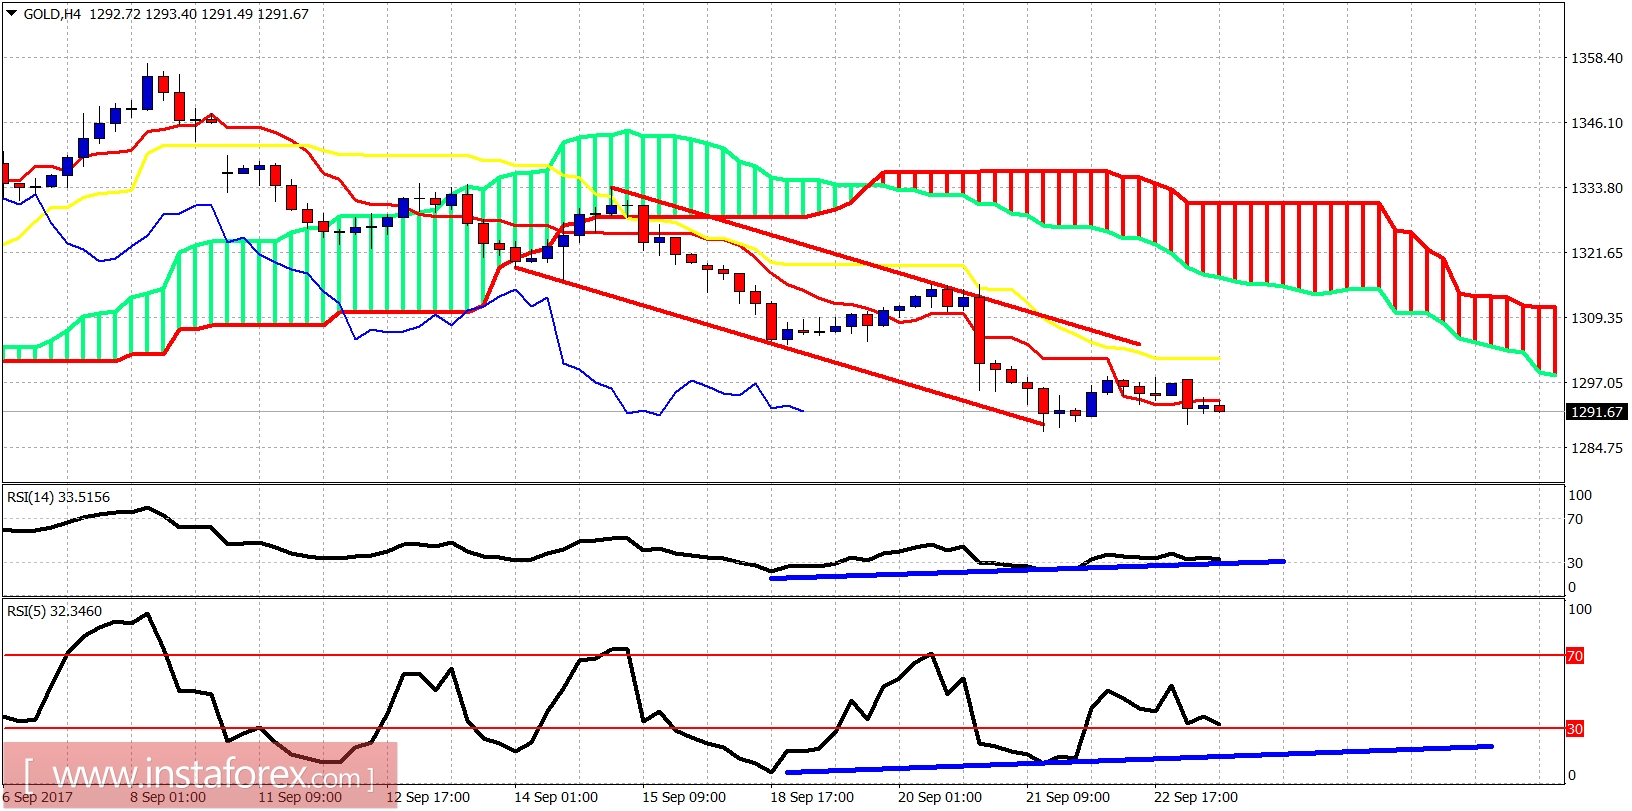
Blue lines - bullish divergence signs
Gold price is below the tenkan- and kijun-sen in the 4-hour chart and inside the bearish channel. Support is at $1,290 and next one at $1,280. Resistance is at $1,300 and next one at $1,316. I believe that Gold price could make another stop run to shake out weak bulls and then reverse.
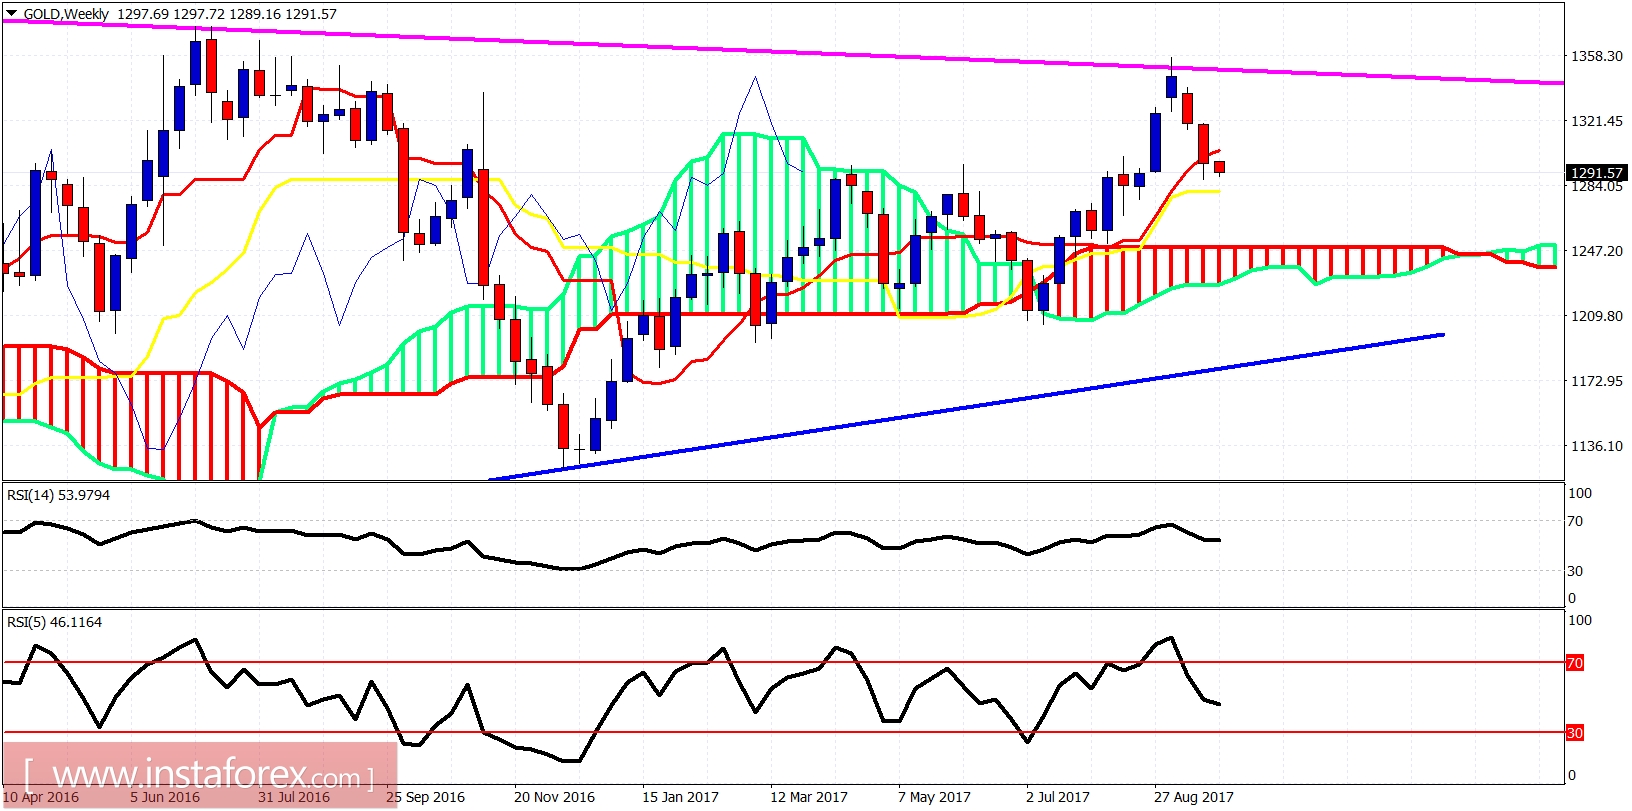
Magenta line - resistance
Blue line - long-term support trend line
Gold price is pulling back from the resistance trend line. This pullback is considered one great buying opportunity. I believe that Gold will bottom around $1,290-$1,280 and then reverse to start the next big upward move towards $1,400. I remain longer-term bullish about Gold.