 English
  Русский
 Bahasa Indonesia
 Bahasa Malay
 ไทย
ไทย Español
 Deutsch
 Български
 Français
 Tiếng Việt
 中文
中文 বাংলা
বাংলা हिन्दी
 Čeština
 Українська
 Română

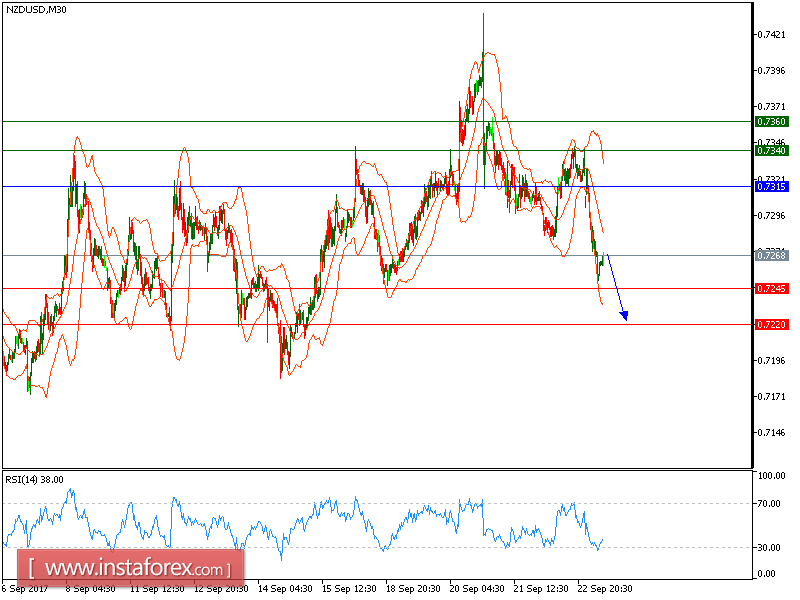
Our first downward target which we predicted in our previous analysis has been hit. NZD/USD is expected to trade with a bearish outlook. The pair retreated from 0.7340 (the high of September 22) and broke below the lower boundary of Bollinger Bands, which signaled the continuation of bearish trend. The 20-period moving average is turning down. The relative strength index shows downward momentum.
To conclude, below 0.7315, look for a further decline with targets at 0.7245 and 0.7220 in extension.
The black line is showing the pivot point. Currently, the price is above the pivot point, which indicates long positions. If it remains below the pivot point, it will indicate short positions. The red lines is showing the support levels and the green line is indicating the resistance levels. These levels can be used to enter and exit trades.
Resistance levels: 0.7340, 0.7360, and 0.7410
Support levels: 0.7245, 0.7220, and 0.7180