 English
  Русский
 Bahasa Indonesia
 Bahasa Malay
 ไทย
ไทย Español
 Deutsch
 Български
 Français
 Tiếng Việt
 中文
中文 বাংলা
বাংলা हिन्दी
 Čeština
 Українська
 Română

The index hovers around the 200 SMA and remains to wait for a fresh catalyst that defines the path for the short-term. The support zone of 91.67 has been tested several times and it seems a decisive move could take place around it. However, bulls have been trying to push USDX above the 200 SMA at H1 chart and if it succeeds, we can expect further gains towards 93.09.
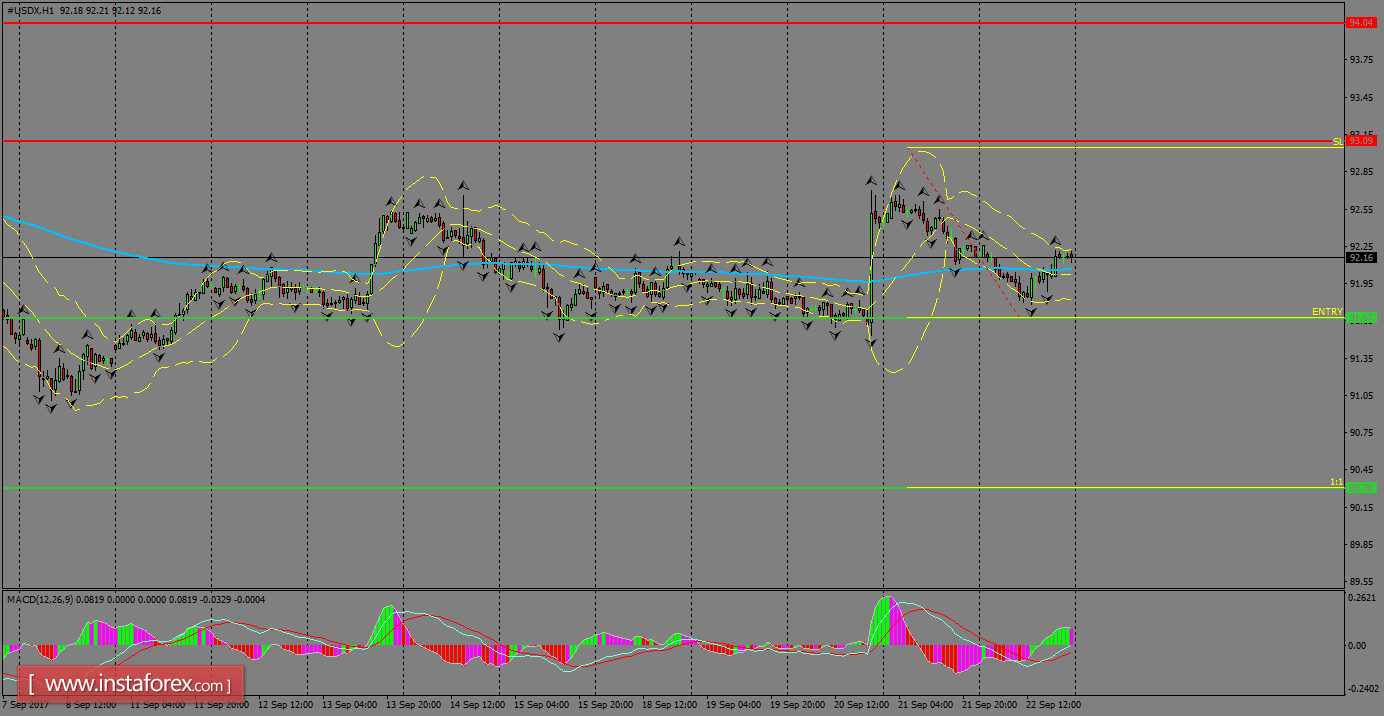
H1 chart's resistance levels: 93.09 / 94.04
H1 chart's support levels: 91.67 / 90.30
Trading recommendations for today: Based on the H1 chart, place sell (short) orders only if the USD Index breaks with a bearish candlestick; the support level is at 91.67, take profit is at 90.30 and stop loss is at 93.04.