 English
  Русский
 Bahasa Indonesia
 Bahasa Malay
 ไทย
ไทย Español
 Deutsch
 Български
 Français
 Tiếng Việt
 中文
中文 বাংলা
বাংলা हिन्दी
 Čeština
 Українська
 Română

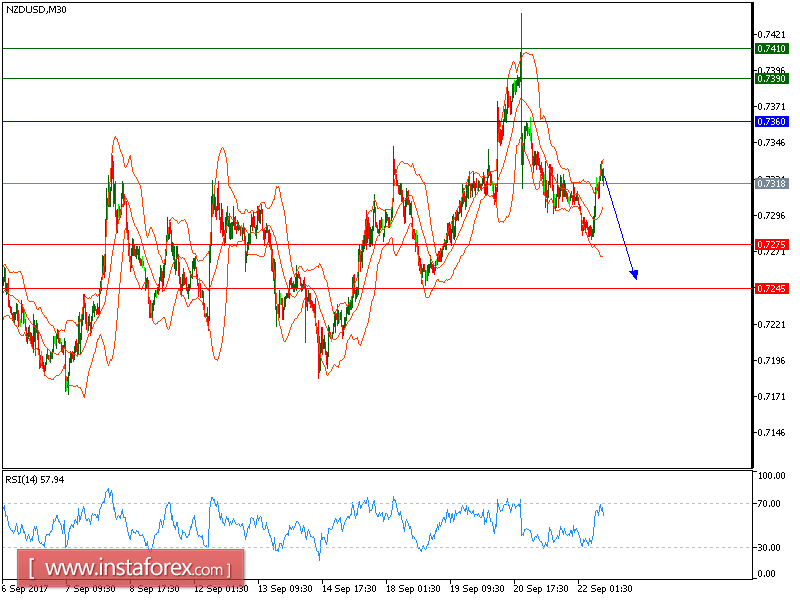
We will retain our yesterday's technical levels. The pair is still under pressure and is trading below its declining 20-period and 50-period moving averages, which play resistance roles and maintain the downside bias. The relative strength index is bearish and calls for a further drop.
To conclude, as long as 0.7360 is not surpassed, a new test to 0.7275 and even to 0.7245 seems more likely to occur.
The black line is showing the pivot point. Currently, the price is above the pivot point, which indicates long positions. If it remains below the pivot point, it will indicate short positions. The red lines is showing the support levels and the green line is indicating the resistance levels. These levels can be used to enter and exit trades.
Resistance levels: 0.7390, 0.7410, and 0.7455
Support levels: 0.7275, 0.7245, and 0.7180